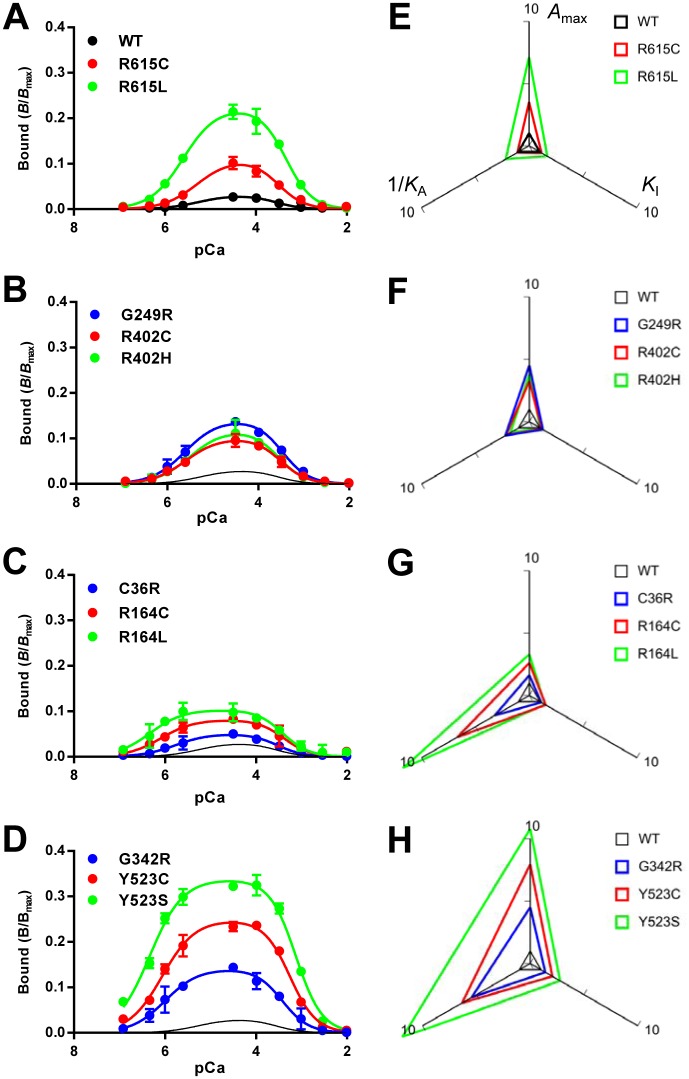
Fig 4. Ca2+-dependent [3H]ryanodine binding of WT and mutant RyR1s.
A–D. Ca2+-dependent [3H]ryanodine binding was determined at 25°C in 0.17 M NaCl, 20 mM MOPSO, pH 6.8, 2 mM dithiothreitol, 1 mM AMP and various concentrations of Ca2+ buffered with 10 mM EGTA. Curves without data points in B–D indicate WT. Data are means ± SE (n = 3–5). Note that the mutants show greater [3H]ryanodine binding than WT. E–H. Activity profiles of the mutant channels. The three parameters, A max, K A and K I, were obtained by fitting analysis (see Materials and Methods) and plotted on the radar charts relative to WT. 1/K A was used as the parameter for activating Ca2+ dissociation constants, in which a larger value represents higher sensitivity. Note that the size of the triangle represents the magnitude of the channel activity.

