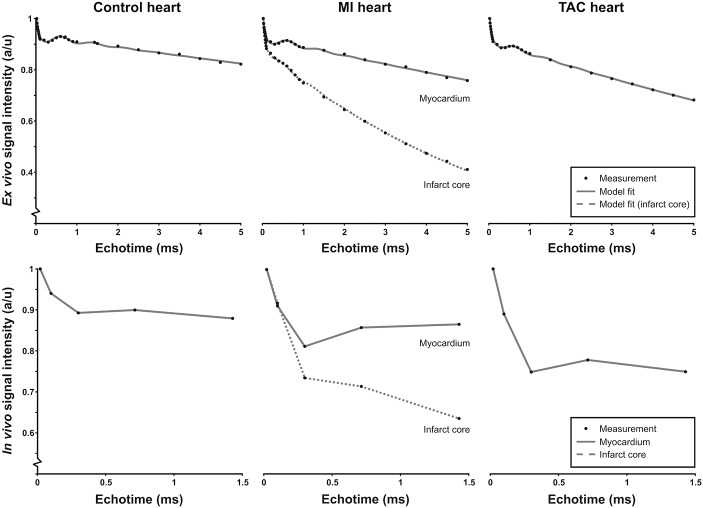
Fig 1. Ex vivo and in vivo signal intensity time curves.
Representative ROI-based T2*-weighted signal intensity curves as a function of echo time (TE) for ex vivo (top row) and in vivo (bottom row) measurements in control hearts, remote tissue and infarct area of the post-MI hearts and the TAC hearts, together with the corresponding model fit (gray line, top row) and lines to guide the eye (bottom row). Signal intensities were normalized to the signal intensity at TE = 21 μs.

