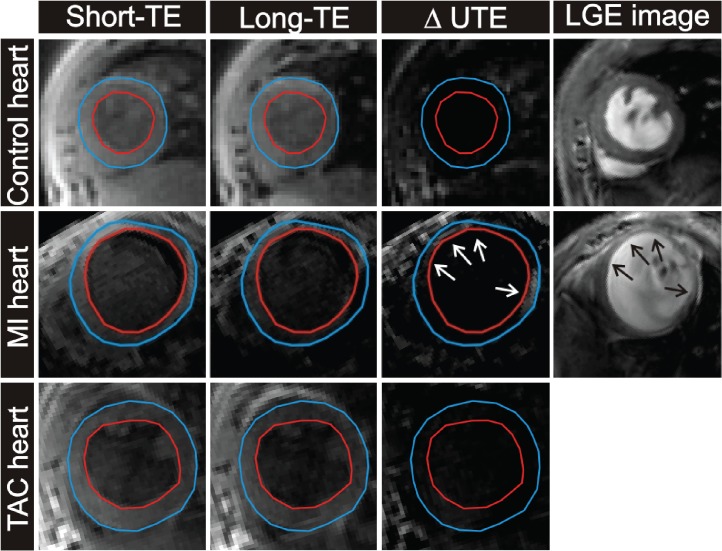
Fig 5. In vivo T2*-weighted images in control heart, a MI heart and a TAC heart.
Examples of a short-axis cross-section of a control heart (top row), a MI heart (middle row) and a TAC heart (bottom row) obtained with the T2*-weighted 3D sequence (short-TE, long-TE and ΔUTE image). LGE scans were obtained in control and post-MI mice (right column). The arrows indicate the infarcted areas.

