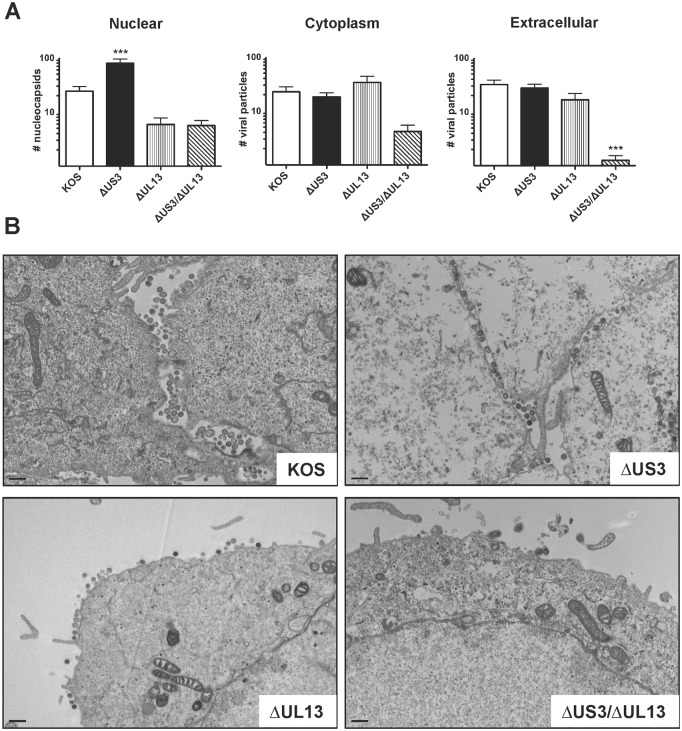
Fig 7. EM analysis of Vero cells infected with ΔUS3 and ΔUL13 HSV-1 mutants.
Monolayers of Vero cells on Thermonox coverslips were inoculated as described in Fig 3. At 16 hours post-inoculation, the monolayers were fixed and processed for EM analyses. (A) Separate images of nucleus, cytoplasm, and plasma membranes/extracellular space were recorded for 20 individual cells per each virus. The number of nucleocapsids and virions were manually counted in each image in a blinded fashion. Results are presented as the mean number of virions per compartment ± sem (n = 20; ***—p<0.001). (B) Representative images of the plasma membranes/extracellular space for cells infected with different viruses (bars represent 500 nm).

