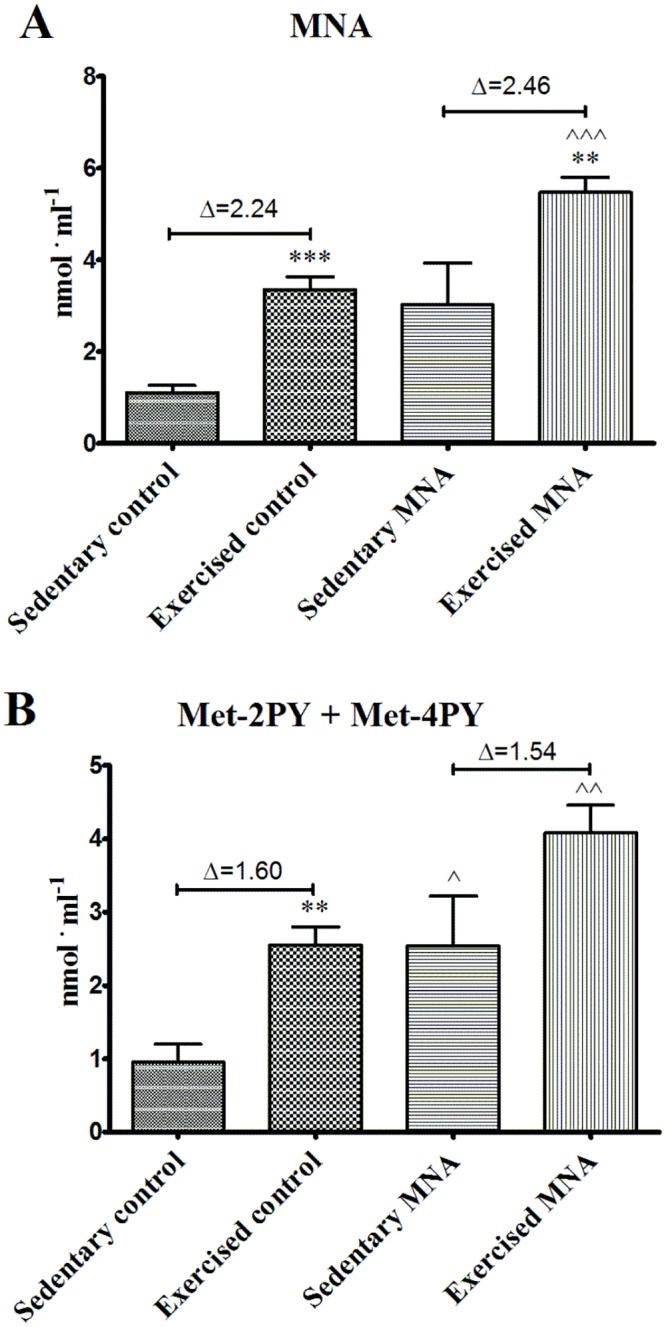
Fig 6. Post-exercise concentrations of MNA and its metabolites in plasma from untreated and MNA-treated db/db mice.

Delta (Δ) denotes the difference between the mean concentration of a given metabolite determined at rest in the sedentary group and in the exercised group of mice after completing the fatiguing run. Data are presented as the mean ±SEM. Statistical analysis was performed using the Mann-Whitney test or unpaired t-test depending on the results of the normality test. **P<0.01, ***P<0.001 vs. corresponding sedentary group; ^P<0.05, ^^P<0.01, ^^^P<0.001 vs. corresponding control group (n = 7–11).
