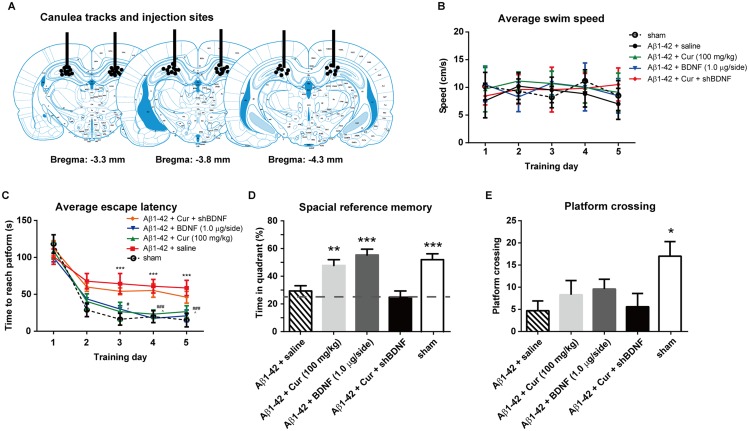
Fig 5. Effect of intra-hippocampal injections of BDNF protein or lentiviral-shBDNF on spatial learning function in the rat model of Alzheimer's disease.
(A) Schematic representation showing the approximate location of microinjections into the VLO. Only rats with injection cannula tips located bilaterally in this site were included. (B) Swim speed in each training trial. (C) The escape latency during the water maze training trials. (D) The time spent in the target quadrant and (E) the number of times crossing the platform in the probe task. n = 8/group. For panel C, ***P < 0.0001, Aβ1–42 + saline vs sham; # P < 0.05, ### P < 0.0001, Aβ1–42 + BDNF vs. Aβ1–42 + saline group; ^ P < 0.05, Aβ1–42 + Cur vs. Aβ1–42 + saline group. For other panels, * P < 0.05, ** P < 0.01, *** P < 0.0001 compared with Aβ1–42 + saline.

