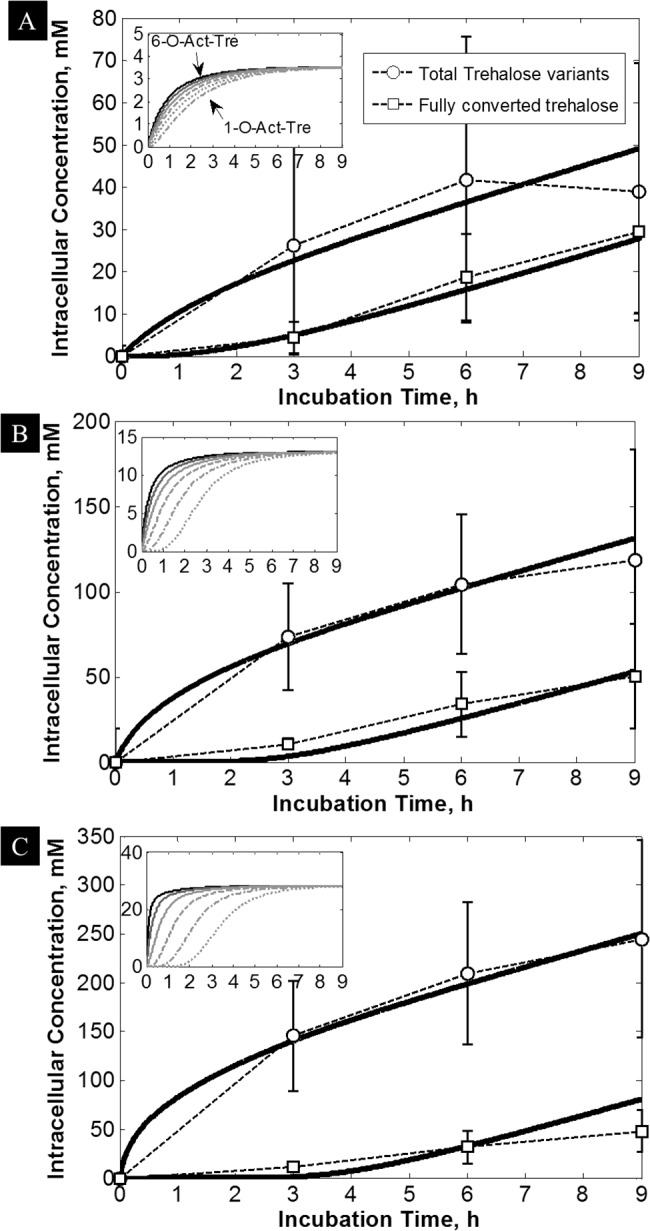
Fig 4. Fitting results of the proposed diffusion-reaction model to the data.

With 3 fitting parameters, the model (solid lines) closely followed the averaged uptake data for trehalose (squares) and total (n)-O-Ac-Tre (circles), which were obtained by incubation with (A) 5mM, (B) 15 mM, and (C) 30 mM 6-O-Ac-Tre. Inset Figures: Predicted increase in the concentration of 6- (black solid line), 5- (dark-gray solid line), 4- (gray solid line), 3- (gray dashed line), 2- (gray dash-dotted line) and 1-O-Ac-Tre (gray dotted line). These results were obtained by averaging the data from at least 3 animals and the error bars represent the animal-to-animal variability.
