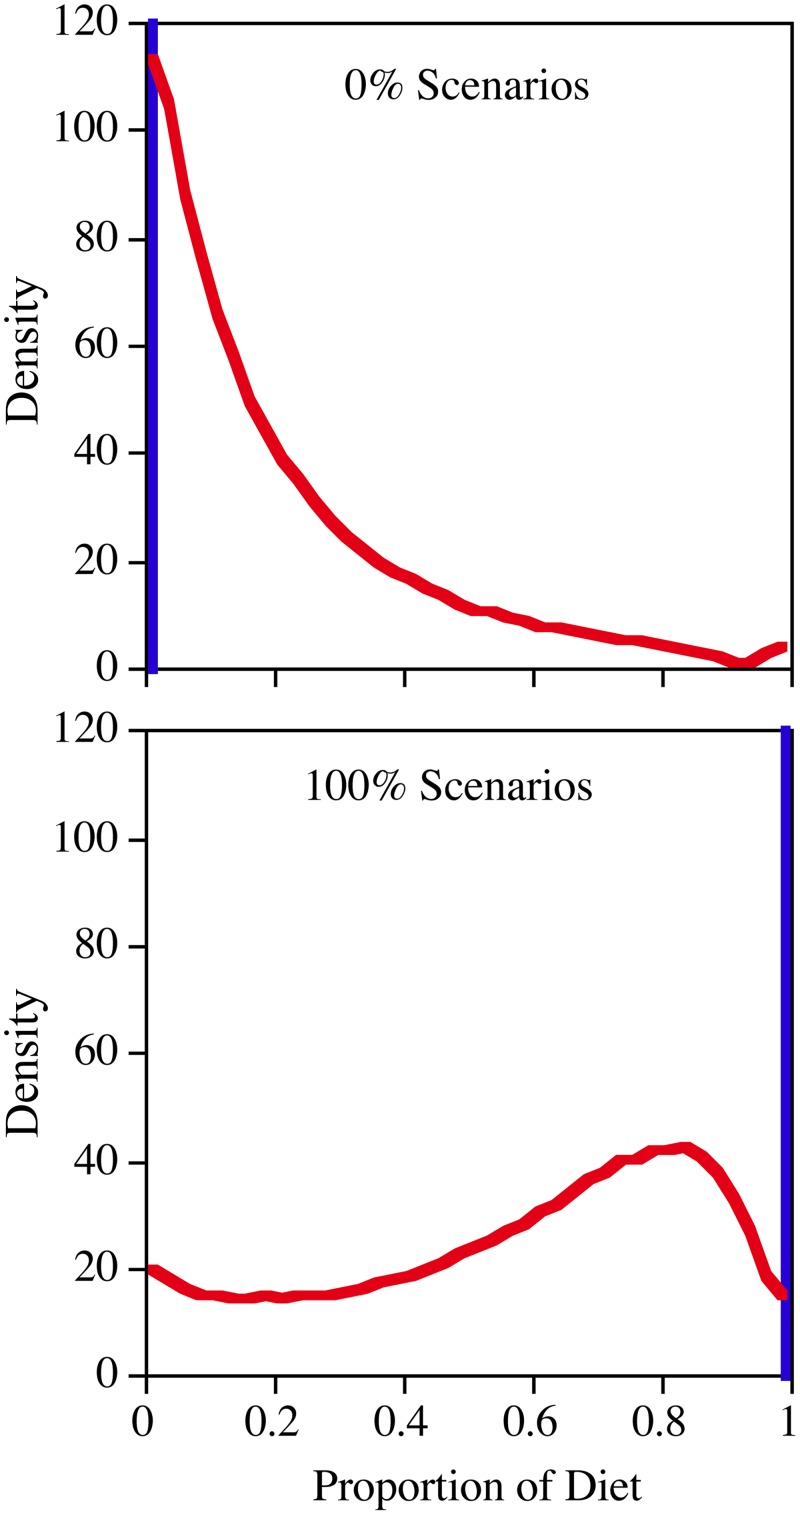
Fig 2. The results of an analysis where three potential food resources were either set to 100% of the food consumed or 0% (e.g., 100% diatoms, 0% green algae, and 0% cyanobacteria).
This resulted in 9 outputs for the three SI based analyses (red). Because the outputs for the three SI cases where the subsidy should have been 100% were very similar, as was also true for the six cases where the subsidy should have been 0%, the three 100% responses and the six 0% responses were aggregated in this plot. For the FA based analyses (blue), we simply analyzed the original 10 cases where Daphnia consumed diatom monocultures. We also analyzed the 8 cases where the Daphnia consumed green algae monocultures as well as the 8 cases where they consumed cryptophyte monocultures. In these 26 cases, the correct answer was always obtained to multiple decimal places. The curves represent the 1/10th percentile (n = 1000) density distribution of the model posterior densities grouped into 40 bins.

