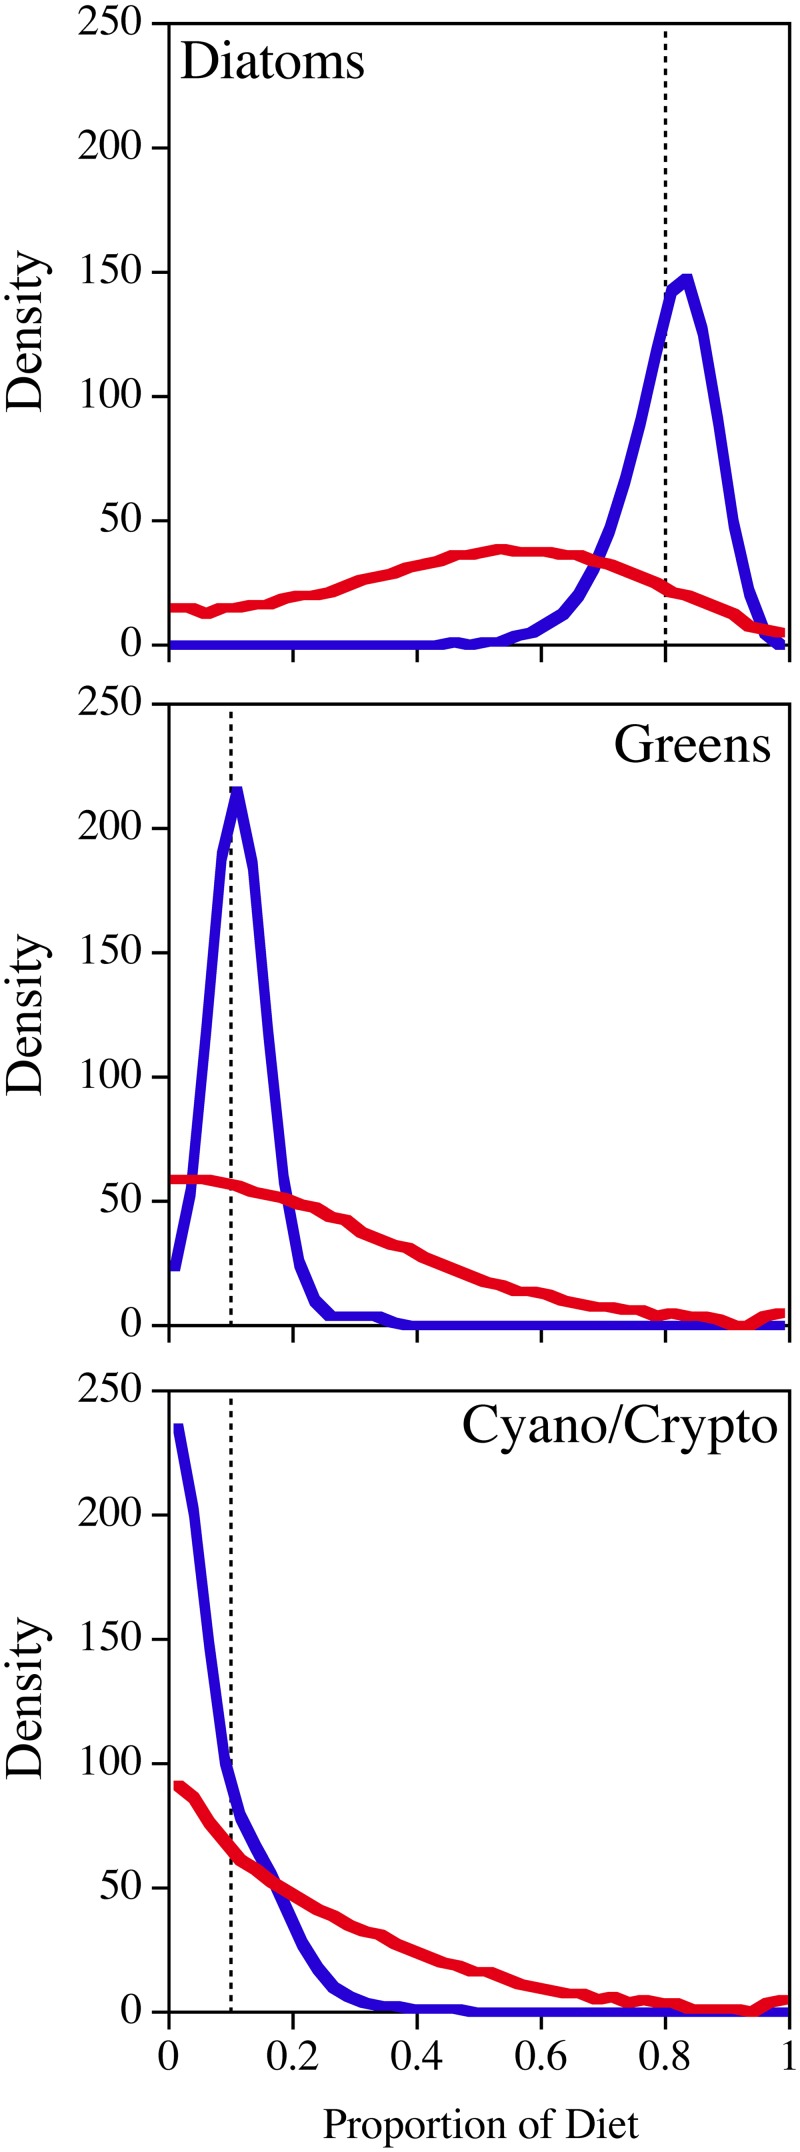
Fig 3. Results from mixed diet simulations for "pseudo-Daphnia" that were comprised of 80% diatoms, 10% green algae and 10% either cyanobacteria or cryptophytes for the SI (red) and FA (blue) based analyses.
These scenarios included full uncertainty for both the resources and fractionation (n = 1000, in groups of 100). The density curves represent the posterior distributions of the 1/10th percentiles (n = 1000) grouped into 40 bins.

