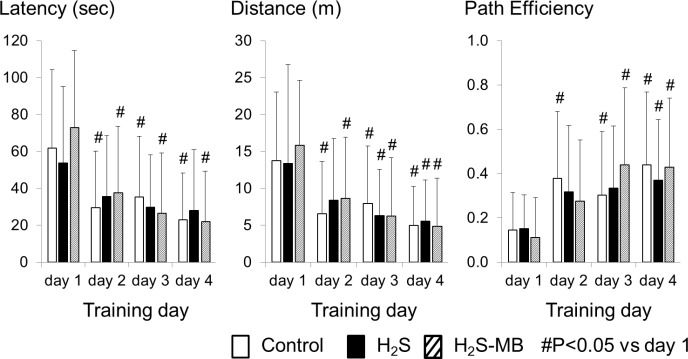
Fig 5. Latency to reach the platform, distance, and path efficiency during Morris water maze testing.
Data shown here correspond to the results obtained in all the rats that were able to swim and to find the platform the 4 tests. All rats decreased the latency and distance to locate the platform and increased the path efficiency throughout the 4 days of training with no difference between groups. In the H2S group, the changes were significant only in for the distance at D3 and D4, and for the path efficiency at D4, due to large standard deviations. Values are shown as mean ± SD. #significantly different from day 1 at P<0.05.

