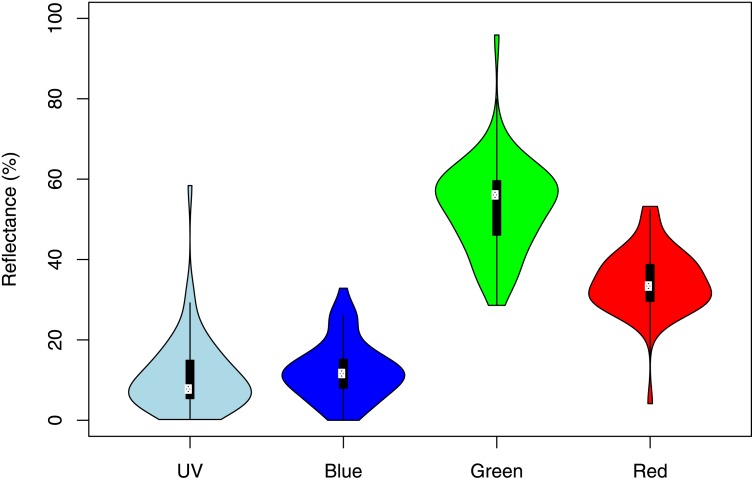
Fig 1. Univariate violin plots showing the reflectance for all fruits in each of the four colour reflectance bands.
Ultraviolet (300-400nm), blue (400-500nm), green (500-600nm), and red (600–700 nm). For each reflectance band, the white dot corresponds to the median, while the lower and upper end of the thick black bars correspond to the 25th and 75th percentiles. The width of the violin plot represents the density of the distribution.

