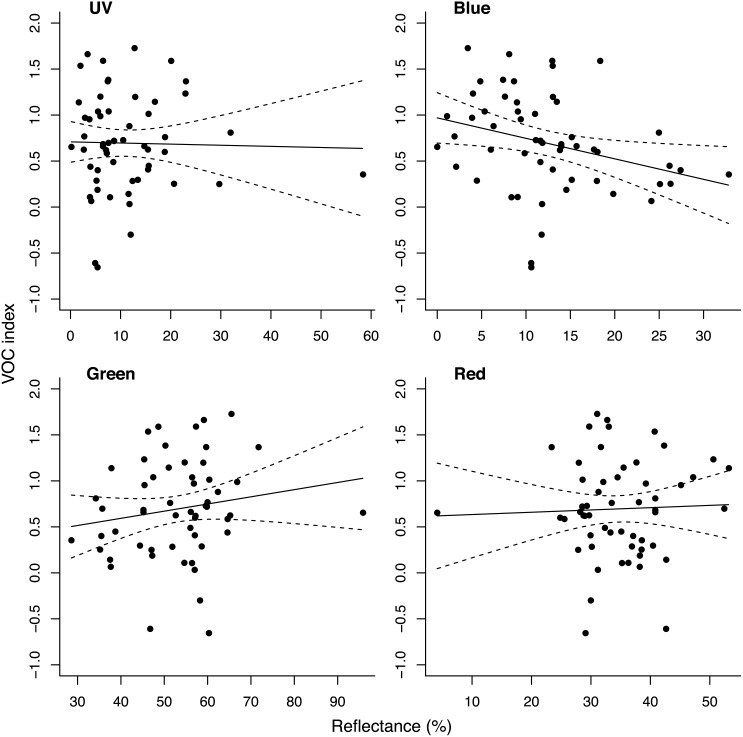
Fig 3. Bivariate scatter plots showing the relationship between overall odour emission (VOC) and reflectance in each of the four colour reflectance bands.
UV (300-400nm), blue (400-500nm), green (500-600nm), and red (600-700nm). Percent reflectance was calculated as regions of the spectrum reflecting in the specified 100nm band divided by the sum of reflectance in the visible range (400-700nm).

