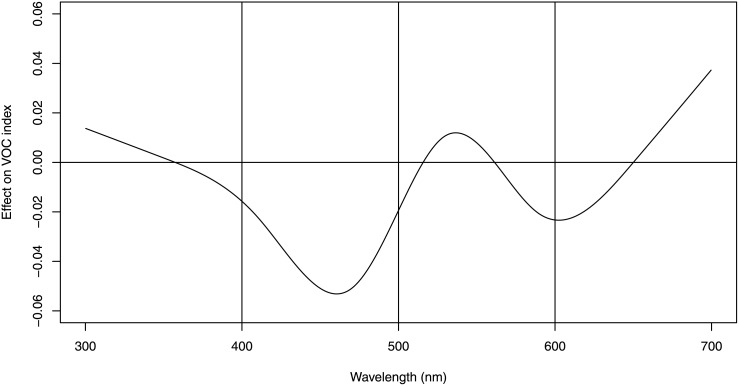
Fig 4. The relationship between overall odour emission (log10 VOC) and reflectance across the 300nm to 700nm colour range.
This analysis was based on a natural cubic spline transformation of the spectrum values (300-700nm). Each one-unit increase of reflectance in the blue spectrum (400-500nm) was associated with an 11% decrease (log10 effect = -0.039, p = 0.009) in VOC while reflectance in the UV, green and red spectra were not associated with VOC.

