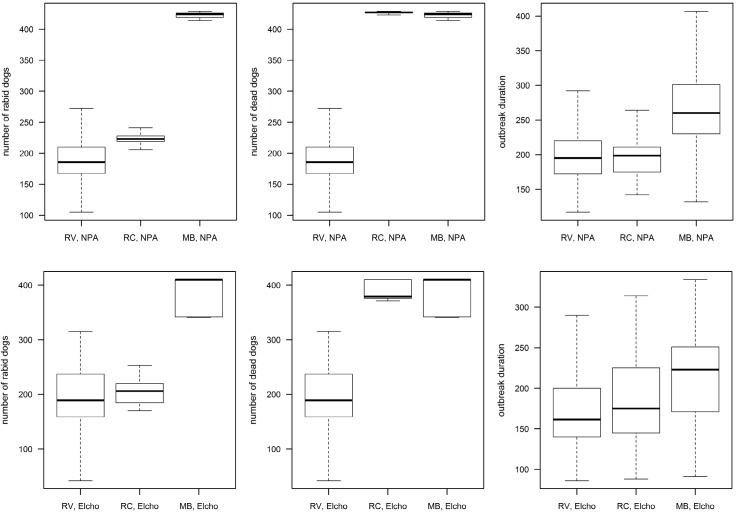
Fig 4. Outbreak results for three example control strategies based in 1000 repetitions per scenario.
Three control strategies (RV = reactive vaccination, RC = reactive culling, MB = movement bans) in two regions (Elcho = Elcho Island, NPA = Northern Peninsula Area) were simulated. Number of rabid dogs, dead dogs (i.e. due to rabies or culling) and outbreak duration per scenario are represented for the NPA (upper line) and for Elcho Island (lower line). The box represents the interquartile range (IQR), the horizontal line in the box the median and the whiskers extend to the most extreme data point which is no more than 1.5 times IQR from the box. Outliers are not shown.

