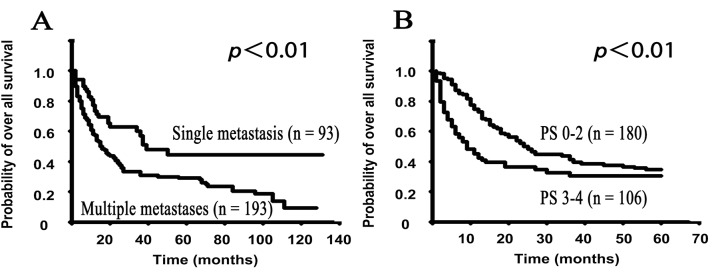
Fig 2. The Kaplan-Meier survival curves show the survival rates regarding skeletal metastases and the performance status (PS) at the first visit in the SMUP cohort.

A: The different skeletal metastasis situations (solitary metastases vs. multiple metastases), B: PS (good PS of 0–2 vs. poor PS of 3–4). A, The Kaplan-Meier curve of the overall survival demonstrated that patients with solitary metastases (MST: 16.0 months) had a longer survival than those with multiple metastases (MST: 39.0 months) (p<0.01). B. To elucidate the early survival rates based on the PS, we employed the limited survival data within five years of follow-up in all 286 SMUP cases, and the data were analyzed using the Kaplan-Meier method. The limited data showed that the good PS group had a better prognosis compared to the poor PS group, and there was a significant difference in the survival of the good and poor PS groups (p<0.01). The non-limited survival data with regard to the PS are shown in S2 Fig
