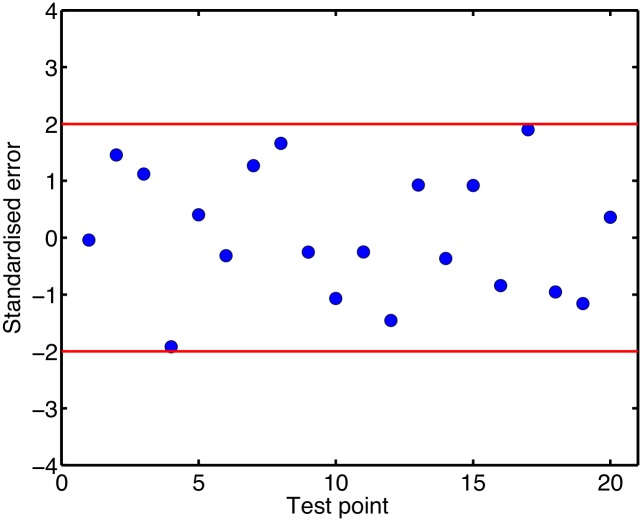
Fig 3. Validation of APD90 emulator output against test data output.
This plot shows the difference in the mean APD90 predicted by the emulator and APD90 obtained from the simulator for each of the 20 test data. The difference is calibrated as the number of standard deviations, and the red lines indicate ±2 standard deviations.

