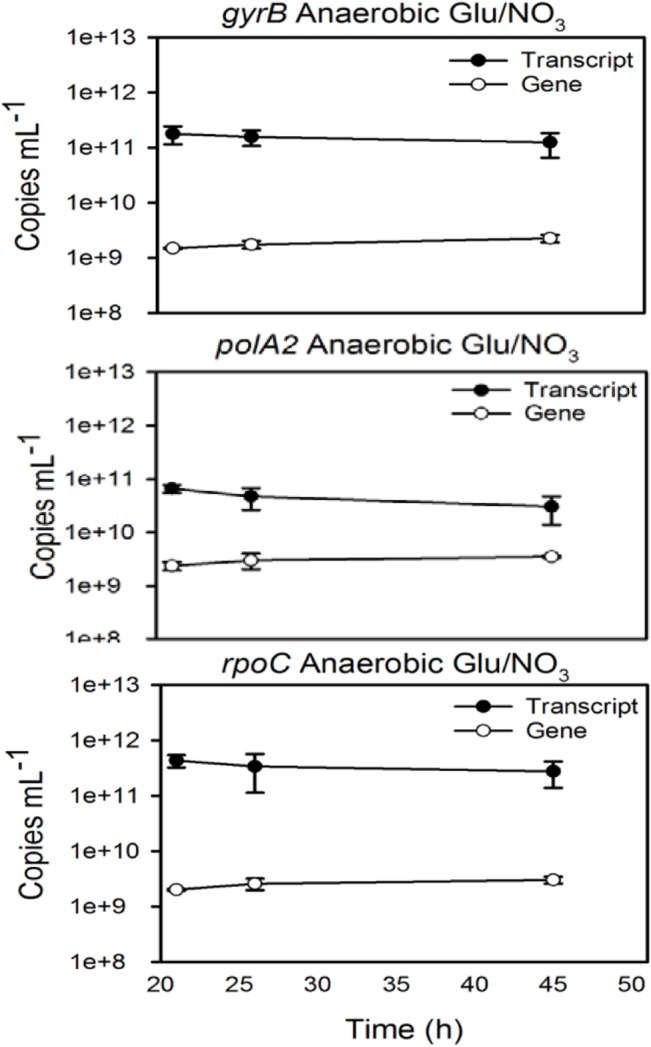
Fig 2. Representative figure of data used to obtain transcript-to-gene ratios for gyrB, polA2, and rpoC.

Samples were collected at multiple time points from anaerobic cultures supplemented with glucose as the carbon source and nitrate as the terminal electron acceptor. Transcript and gene copies per mL of sample were calculated via absolute quantification using external calibration curves. Error bars represent the standard deviation derived from triplicate qPCRs from three biological replicates.
