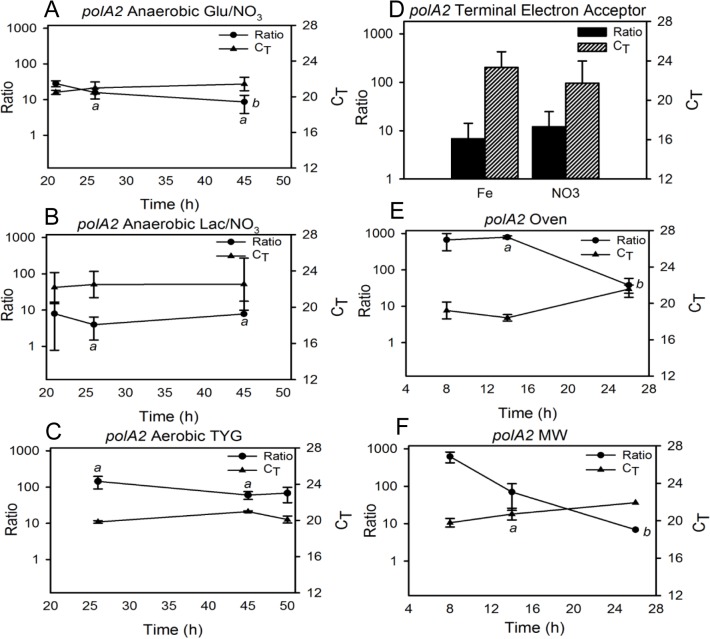
Fig 5. Correlation between polA2 transcript CT values and gene expression as derived from the transcript-to-gene copy number ratios.
A standard curve was constructed and used to calculate the transcript copies per mL of sample and gene copies per mL of sample (“transcript-to-gene ratio”) under the different culture conditions described in the text. Ratio and CT values obtained for polA2 under: anaerobic growth with (A) glucose or (B) lactate as carbon source compared to (C) small-volume aerobic growth in TYG; (D) anaerobic growth with glucose as carbon source and nitrate or iron as terminal electron acceptor; and aerobic growth in TYG using (E) oven or (F) microwave heating. Glu = glucose, Lac = lactate, MW = microwave heating. a = indicates statistically significant difference (p < 0.05) among different culture conditions at specific time points; b = indicates statistically significant difference (p < 0.05) across time under one culture condition.

