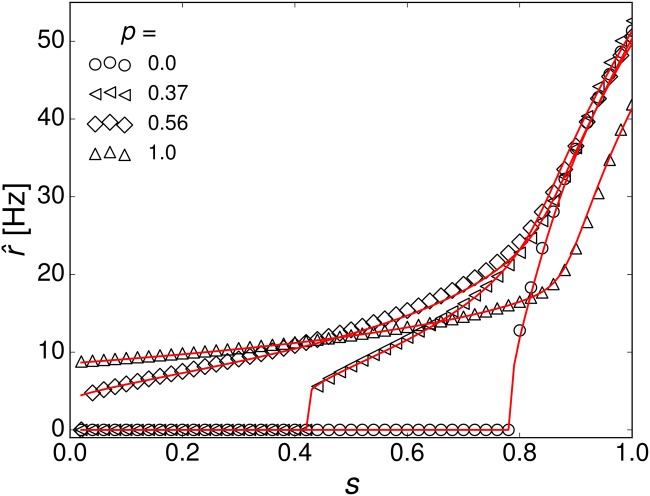
Fig 4. Mean firing rate of the uncorrelated and correlated networks in the sub-threshold regime from simulations (open symbols) and mean-field theory (straight red lines).
The joint degree distributions N kk′ for the mean-field calculations were sampled from the adjacency matrices of the constructed networks (N = 105).

