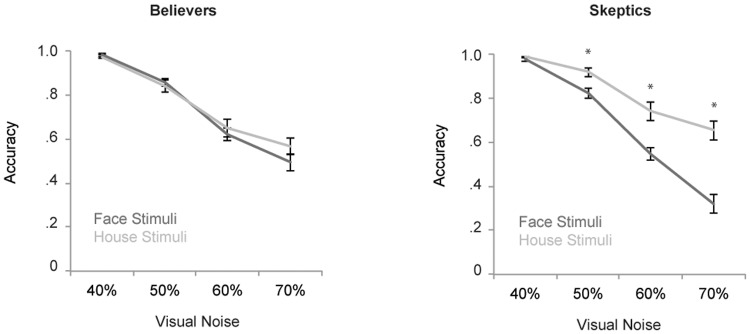
Fig 3. Accuracy for the face / house categorization task.

The left graph represents the accuracy for believers and the right graph for skeptics. The x-axis represents the different levels of visual noise (40%, 50%, 60% and 70%). Dark lines represent responses to face stimuli and light lines represent responses to house stimuli. Error bars represent standard errors.
