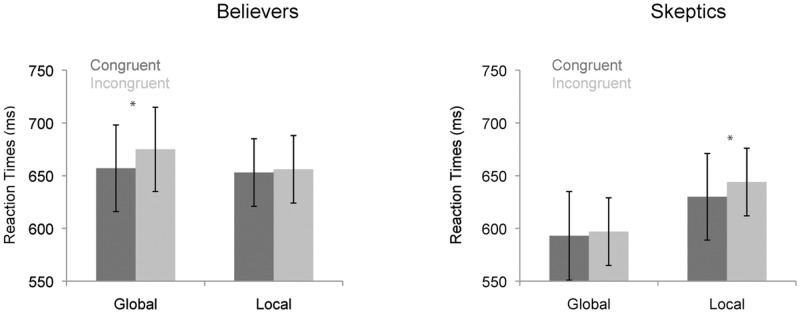
Fig 4. Reaction times for the global / local processing task.

The left graph represents responses for believers in conspiracy theories and the right graph for skeptics. Left bars represent responses during ‘attend-to-global’ blocks and right bars for ‘attend-to-local’ blocks. Dark bars represent congruent and light bars incongruent trials. Error bars represent standard errors.
