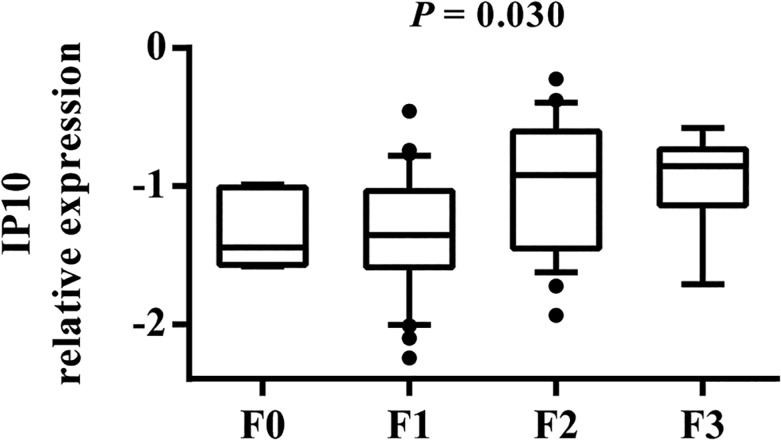
Fig 3. Association between IP10 expression and the progression of liver fibrosis.
The y-axis shows the relative unit of a given gene, normalized to GAPDH in log scale, as a box plot displaying the 10th, 25th, 50th, 75th, and 90th percentiles of expression levels. The P value was obtained by the Kruskal-Wallis test. F0, F1, F2, and F3 (fibrosis stages) are defined according to the modified Scheuer classification.

