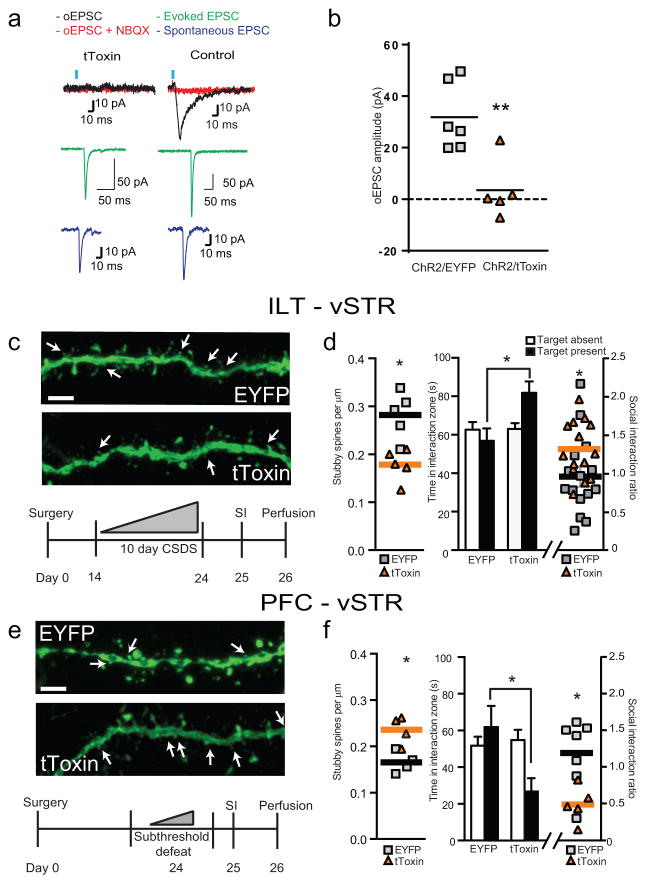
Figure 2.
tToxin–mediated inhibition of ILT–vSTR and PFC–vSTR projections regulates stress–induced behavioral and synaptic plasticity. (a) Representative traces of EPSCs from vSTR MSNs; left – ChR2 + tToxin, right – ChR2 + EYFP control. Black trace – oEPSC; red trace – oEPSC in the presence of NBQX; green trace – electrically evoked EPSC; blue trace – spontaneous EPSC (a trace is 20 responses from a cell averaged). (b) Average oEPSC amplitude (EYFP/tToxin, n = 5/6 cells, 2/2 mice, unpaired t–test ** p = 0.004, t = 3.796 df = 9). (c) 3–D reconstructions of MSN dendrites (white arrows–stubby spines; scale bar = 5 μm; top). Experimental timeline for ILT–vSTR circuit (bottom). (d) Quantification of stubby spine densities (n = 5 mice per group, unpaired t–test, * p = 0.003, t = 4.017 df = 8; left). Quantification of time spent in the interaction zone and social interaction ratio (EYFP/tToxin, n = 15/14 mice, two–way ANOVA (Time spent) * p = 0.019, F(1, 54) = 5.809 (interaction), unpaired t–test (SI ratio) * p = 0.04, t = 2.143 df = 27; right). (e) 3–D reconstructions of MSN dendrites (white arrows–stubby spines; scale bar = 5 μm; top). Experimental timeline for PFC–vSTR circuit (bottom). (f) Quantification of stubby spine densities (n = 4 mice per group, unpaired t–test, * p = 0.014, t = 3.421 df = 6; left). Quantification of time spent in the interaction zone and social interaction ratio (EYFP/tToxin, n = 7/5 mice, two–ANOVA (Time spent) * p = 0.034, F(1, 20) = 5.170 (interaction), unpaired t–test (SI ratio) * p = 0.013, t = 3.013 df = 10; right). All error bars represent the s.e.m.

