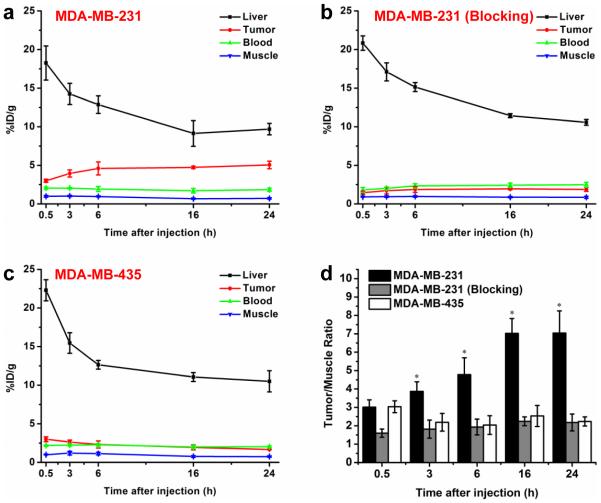
Fig. 4.
Quantitative analysis of the PET data. a Time activity curves of the liver, MDA-MB-231 tumor, blood, and muscle upon intravenous injection of 64Cu-NOTA-ALT-836-Fab (positive group). b Time activity curves of the liver, MDA-MB-231 tumor, blood, and muscle upon intravenous injection of 64Cu-NOTA-ALT-836-Fab after pre-injection of 2 mg ALT-836 (blocking group). c Time activity curves of the liver, MDA-MB-435 tumor, blood, and muscle upon intravenous injection of 64Cu-NOTA-ALT-836-Fab (negative group). d Comparison of tumor/muscle ratio in positive, blocking and negative groups. The differences of the tumor uptake and tumor/muscle ratio in three groups were statistically significant (P < 0.05) at all time points except 0.5 h. All data represent 4 mice per group.

