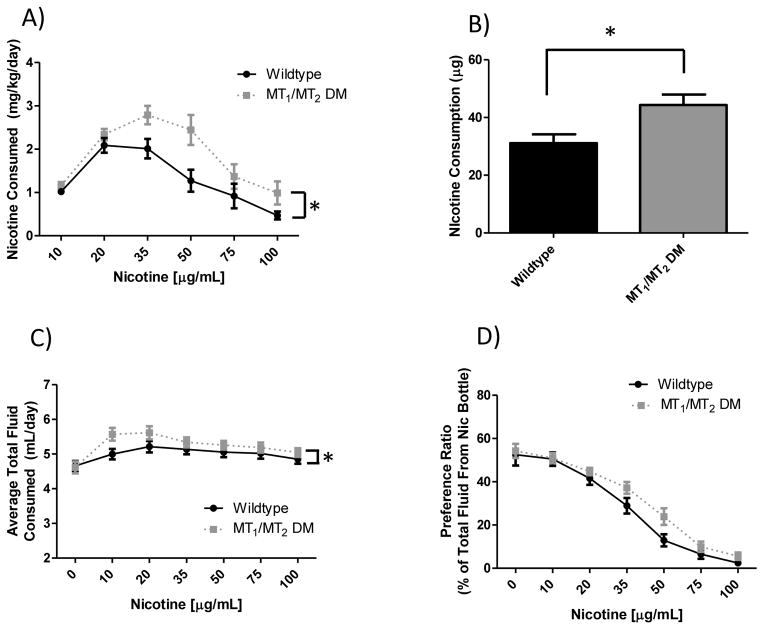
Figure 3. Effect of melatonin signaling on nicotine 2-bottle preference drinking in C3H mice.
Panel (A) shows nicotine dose consumed. There was a significant main effect of nicotine concentration (F5, 180 = 19.18, p > 0.0001), and genotype (F1, 180 = 18.84, p > 0.0001) with MT1/MT2 DM animals drinking more nicotine. Panel (B) shows total nicotine intake over the course of the study where a significant effect of genotype (t = 2.78, df = 32, p < 0.01) was observed. Panel (C) shows total fluid intake which demonstrated a significant main effect of nicotine concentration (F6, 180 = 13.20, p < 0.0001) and genotype (F1, 180 = 3.46, p = 0.21), which resulted in slightly increased fluid intake in null mutant animals. Post-hoc tests revealed no significant difference at any nicotine concentration for genotype, though the 10 and 20 μg/mL concentrations approached significance. Panel (D) shows nicotine preference, which displayed a main effect of nicotine concentration (F6, 180 = 72.10, p < 0.0001) and a trend towards significance for genotype (F1, 180 = 1.02, p = 0.063). Data is represented as mean ± SEM and n=16 wildtype and 16 DM mice. MT1/MT2 DM = MT1 and MT2 double melatonin receptor null mutant animals. *denotes main effect differences between wildtype and MT1/MT2 DM animals.

