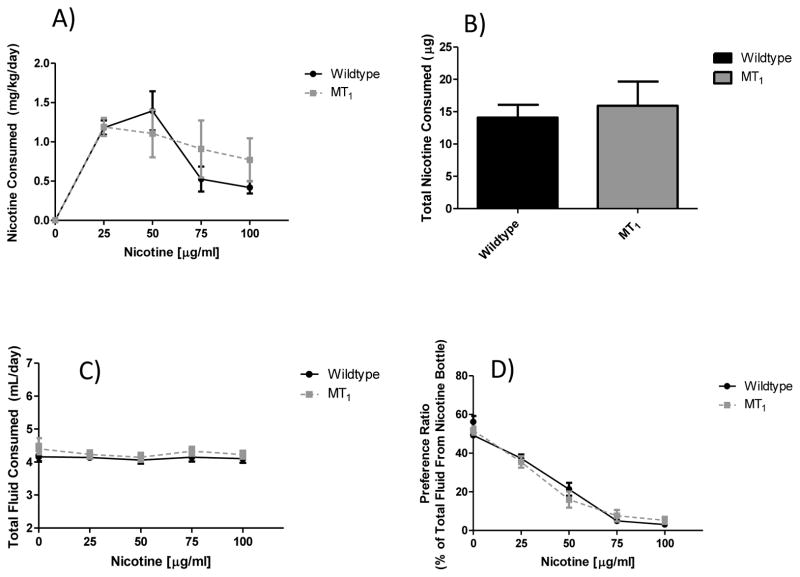
Figure 5. Effect of genetic deletion of only the MT1 melatonin receptor on nicotine preference drinking.
Panel (A) shows nicotine consumption by nicotine concentration. No significant main effect of genotype was observed (F1, 100 = 0.19, p = 0.67), but there was a main effect of nicotine concentration (F4, 100 = 22.55, p < 0.0001). Panel (B) shows total nicotine consumption across the entire study, where no significant effect of genotype was observed (t = 0.44, df = 25, p = 0.67). As seen in panel (C) there were no significant main effects of nicotine concentration (F4, 100 = 2.36, p = 0.06) or genotype (F1, 100 = 0.82, p = 0.37) on total fluid consumption. Finally, in panel (D) there was no main effect of genotype (F1, 100 = 0.0003, p = 1.0) on preference for the nicotine bottle, however there was a significant main effect of nicotine concentration (F4, 100 = 230.7, p < 0.0001). Values are presented as mean (SEM) and n = 14 control and 13 MT1 null mutant.

