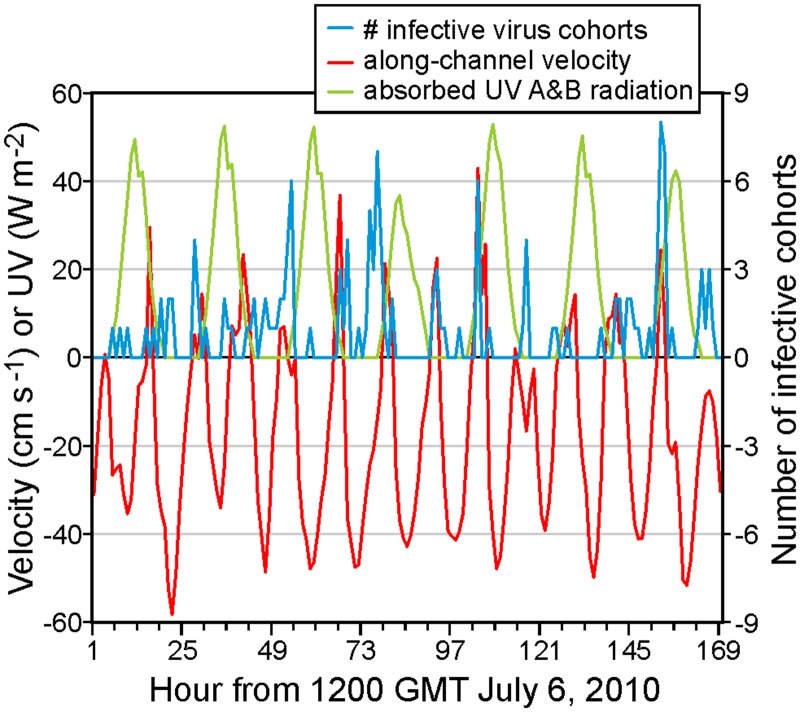
Fig 5. Number of infective cohorts arriving at farm 17 from farm 16 (blue), along-channel model velocity (cm s-1) at 10 m depth at the location of mooring NC1 (red), and UV (A and B) radiation (W m-2, green), as in Fig 4.
The time period is 1300 GMT July 6 2010 to 1300 GMT July 13 2010.

