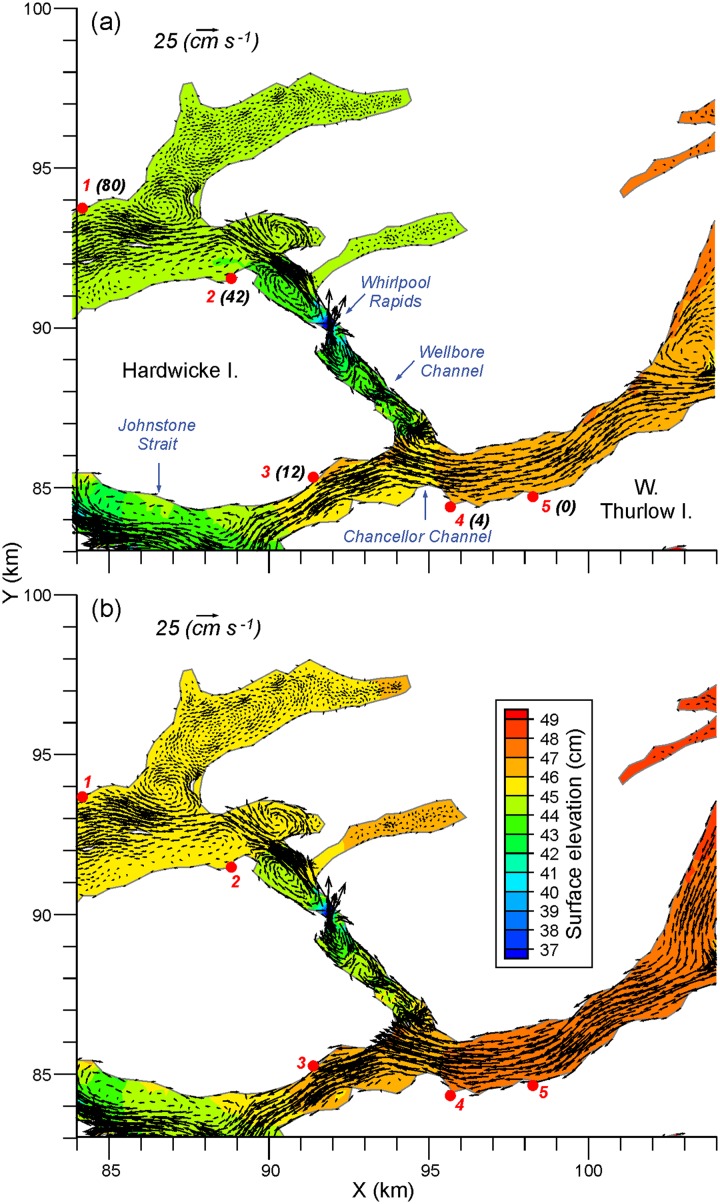
Fig 7. Average a) April and b) July mean surface elevations (cm) and flows (cm/s) at 10m depth in the Chancellor Channel region.
Numbered red dots denote farms, as in Fig 1 while the black bracketed numbers denote the number of days since the first IHNV outbreak was reported at farm 5 in August 2001. (These numbers were taken from Table 1 in [7].)

