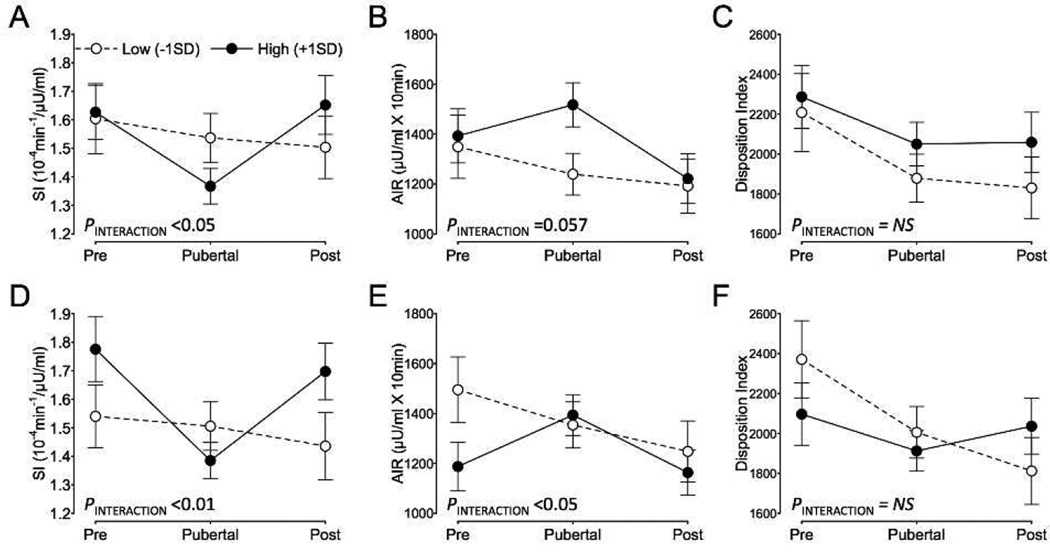
Figure 2.
A–C: Estimated marginal means for insulin sensitivity (SI; A), acute insulin response (AIR; B), and the disposition index (C) at each pubertal stage for high and low levels of baseline MCP-1. D–F: SI (D), AIR (E), and the disposition index (F) for high and low levels of baseline IL-6. Back-transformed estimates are adjusted for years-elapsed, gender, baseline and changefrom- baseline in TFM and VAT. N=158 in total, with 97, 286 and 180 measurements at pre-, puberty, and post-puberty. 1-SD corresponds to 84 and 8pg/ml for baseline MCP-1 and IL-6, respectively.

