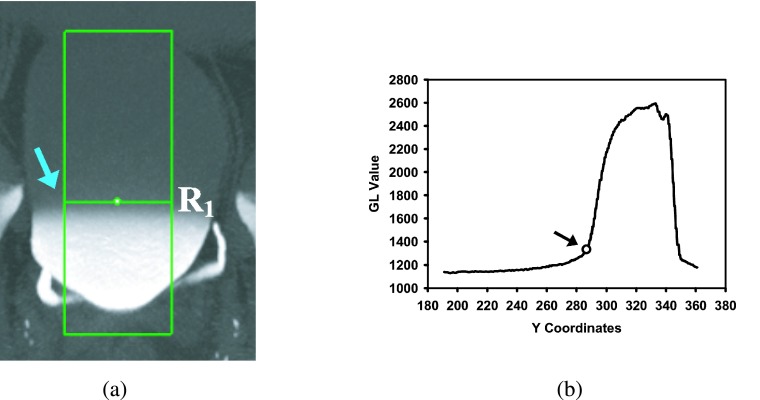
FIG. 5.
Estimation of boundary (row R1) between the NC and C regions. (a) The box used to calculate the average bladder GL profile shown in (b). The arrow points to the row of which the y-coordinate was determined to be that of R1. (b) Profile of the average GL values for each row of the box in (a). The arrow indicates the average GL of the first row that has value above the 1330 threshold and therefore identified as R1.

