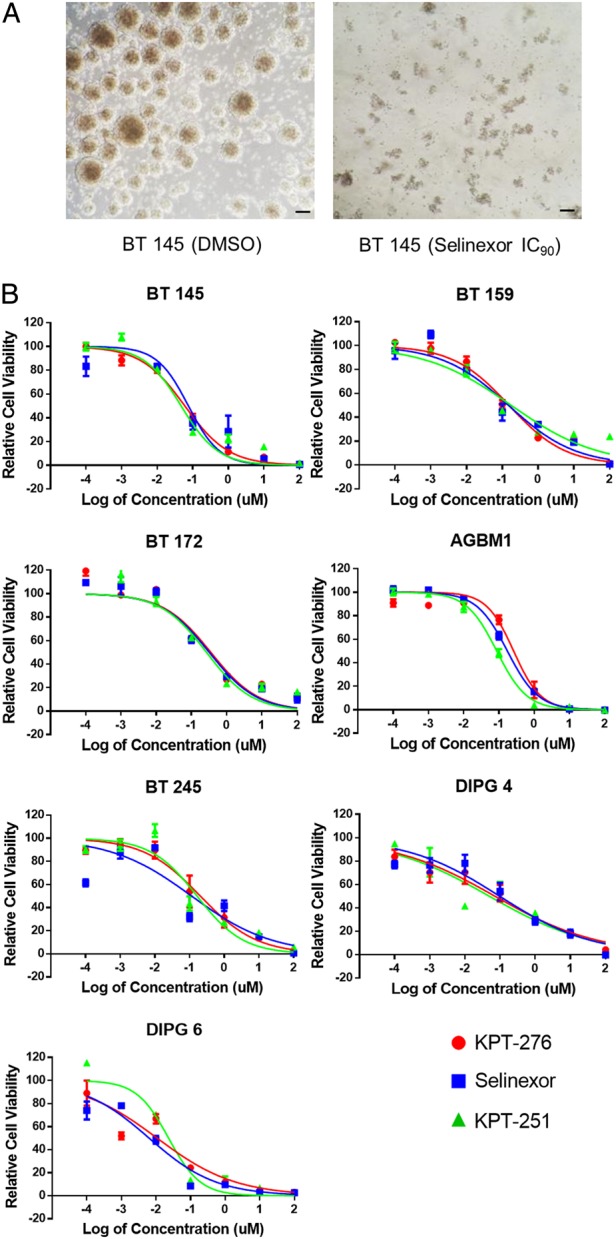
Fig. 2.

In vitro effects of SINE compounds. (A) Representative light microscopy images of BT 145 DMSO control neurospheres vs those treated with the IC90 concentration of Selinexor (scale bars, 100 μm). (B) Dose-response curves of 7 primary human GBM lines to 3 SINE compounds, shown as mean ± SEM fluorescence intensity level relative to DMSO control.
