Fig. 3.

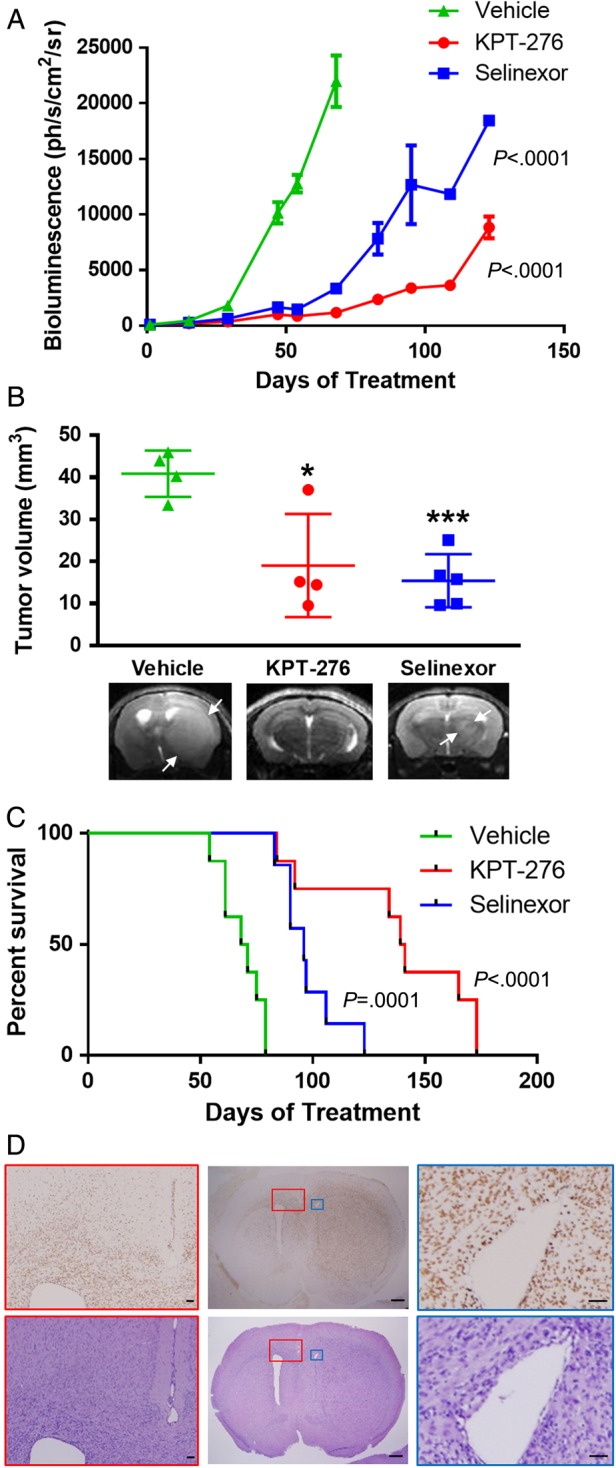
In vivo efficacy of SINE compounds. (A) Tumor growth, measured by mean BLI ± SEM, over time from start of treatment in groups of mice with intracranial GBM xenografts treated with Selinexor, KPT-276, or vehicle. (B) Comparison of tumor volumes (individual values plotted, with bars showing mean ± SD), measured on MRI, for subsets of mice from each group done on treatment day 61, with representative T2 MRIs. (C) Kaplan–Meier curve of mouse survival over time from start of treatment for each group. (D) Representative H&E and human-specific NUMA1 IHC images of a vehicle-treated mouse brain from the PDX study, with a horizontal section in the center showing the main tumor mass with diffuse tumor infiltration and midline shift (scale bars, 1 mm), and inset views of the corpus callosum and lateral ventricle contralateral to the tumor (red boxes; scale bars, 100 μm) and lateral ventricle ipsilateral to the tumor, showing compression (blue boxes; scale bars, 100 μm).
