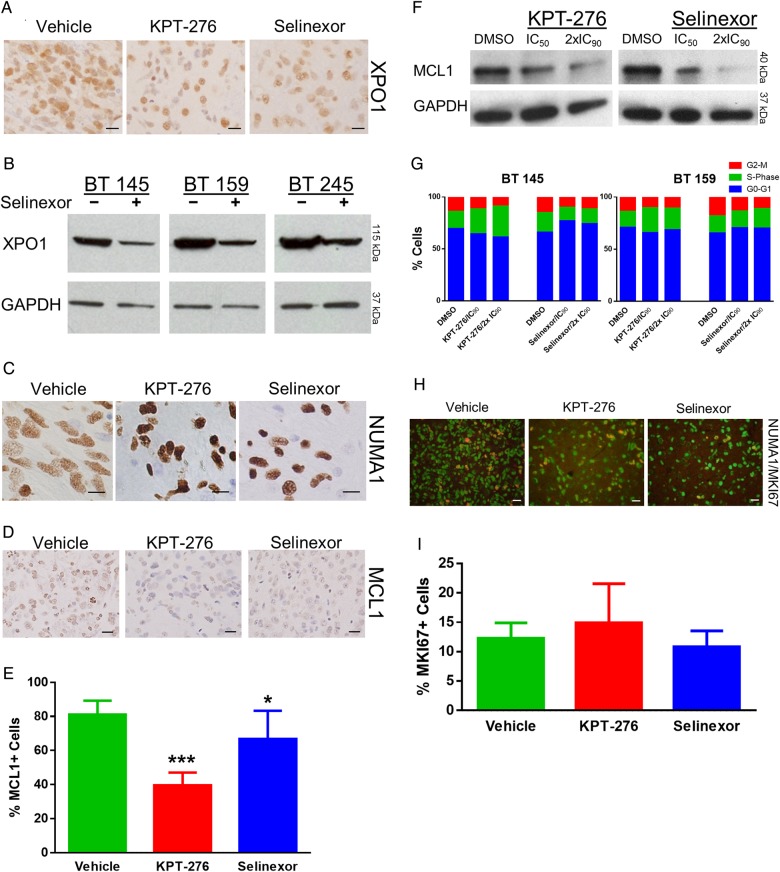
Fig. 4.
Pharmacodynamic efficacy and lack of proliferation effect of SINE compounds. (A) Representative images of XPO1 IHC for each of the murine intracranial xenograft groups (scale bars, 20 μm). (B) Western blot for XPO1 in 3 tumor lines treated with the IC50 dose of Selinexor compared with DMSO control; GAPDH, glyceraldehyde 3-phosphate dehydrogenase. (C) Representative images of NUMA1 IHC for each of the murine intracranial xenograft groups (scale bars, 10 μm). (D) Representative images of MCL1 IHC staining for each of the murine intracranial xenograft groups (scale bars, 20 μm). (E) Mean ± SD percentages of MCL1+ cells for each of the murine intracranial xenograft groups. (F) Western blot for MCL1 in AGBM1 cells treated with IC50 and double the IC90 levels of KPT-276 and Selinexor vs control. (G) Percentage of cells in each cell cycle phase, as determined by propidium iodide flow cytometry, after treatment of 2 tumor lines in neurosphere culture with KPT-276 or Selinexor at the line-specific IC90 or double the IC90 concentration vs control. (H) Representative merged images of NUMA1 and MKI67 IF for each of the murine intracranial xenograft groups (scale bars, 20 μm). (I) Mean ± SD percentage of NUMA1+ cells that were also MKI67+ for each of the murine intracranial xenograft groups.

