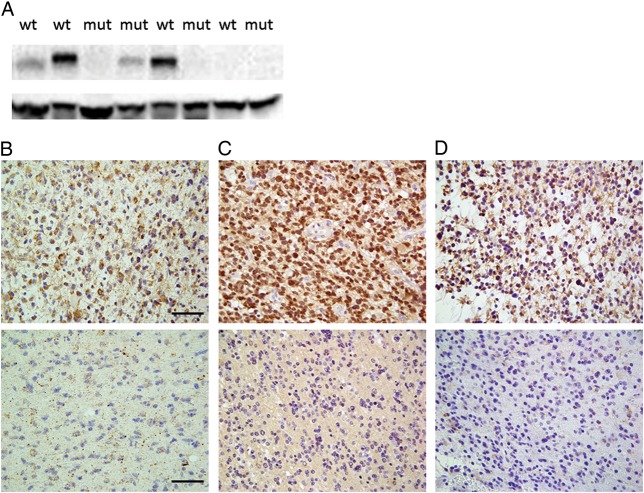
Fig. 2.
(A) Representative Western blots. The upper and lower bands show CD133 and β-actin expression (130 and 47 kDa, respectively). (B–D) Representative image of anaplastic glioma tissue sections immunohistochemically stained with an anti-CD133 antibody (B), anti-SOX2 antibody (C), or anti-NESTIN antibody (D). Positively stained cells are shown in brown. The upper panels illustrate a case with positively stained cells, and the lower panels illustrate a case with few positive cells. Scale bar, 40 μm. Abbreviations: mut, mutant IDH; wt, wild-type IDH.

