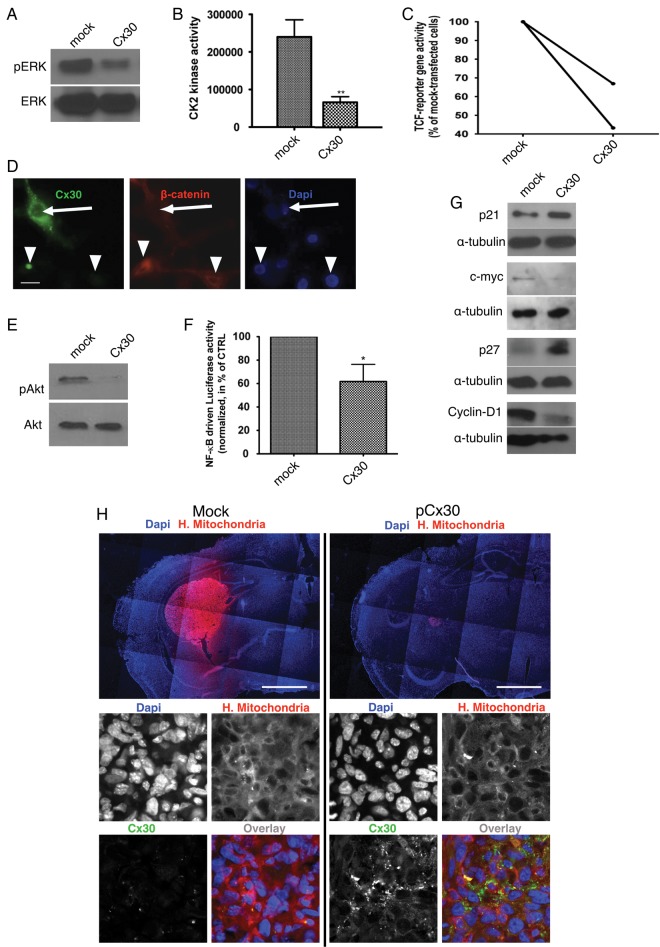
Fig. 1.
Mechanisms of Cx30 effects on cell growth and proliferation in glioma cells. (A) Western blot analysis of phosphoERK and ERK expression in Cx30-expressing U87 cells compared with mock-transfected cells. This is representative of 3 independent experiments. (B) CK2 kinase activity is decreased in U87 cells following restoration of Cx30 expression. Kinase activities are shown as the mean ± SD of 3 independent experiments (**P < .01, Student's t-test, see text for details). (C) Forced expression of Cx30 reproducibly decreased beta-catenin TCF reporter gene activity in U87 cells (the results of 2 independent experiments are shown). (D) Immunofluorescence analysis showing a mainly cytoplasmic localization of beta-catenin (red) in Cx30-expressing cells (green) and a perinuclear localization in nontransfected cells (arrows). Nuclei are stained with 4′,6′-diamidino-2-phenylindole (DAPI) (blue). Scale bar = 20 μm. (E) Western blot analysis of phosphoAkt and Akt expression showed a decreased phosphorylation of this kinase in Cx30-expressing U87 cells compared with mock-transfected cells. This is representative of 3 independent experiments. (F) NF-kappaB driven luciferase activity is decreased in Cx30-expressing U87 cells compared with mock-transfected cells (n = 3, *P < .05, paired Student's t-test). (G) Forced expression of Cx30 in U87 cells respectively enhanced the expression of p21Cip and p27Kip and inhibited that of cyclin D1 and cMyc. These western blots are representative of 3 independent experiments. (H) In vivo effect of Cx30 expression on human glioma tumor growth. Intracranial implantation of a suspension of U87 cells transfected with a Cx30 expression vector or a control vector in the striatum of immunodeficient mice. Brain slices were stained using a monoclonal antibody to human mitochondria and red-fluorescent dye-coupled secondary antibody. After 4 weeks, the tumor mass was significantly smaller in Cx30-expressing xenografts in comparison with the mock-transfected ones (see text for details). Inserts: Immunofluorescence staining for Cx30 (green), human mitochondria (red), and human nuclei (blue). Scale bars: 1100 μm (upper panel) and 30 μm (lower panel).

