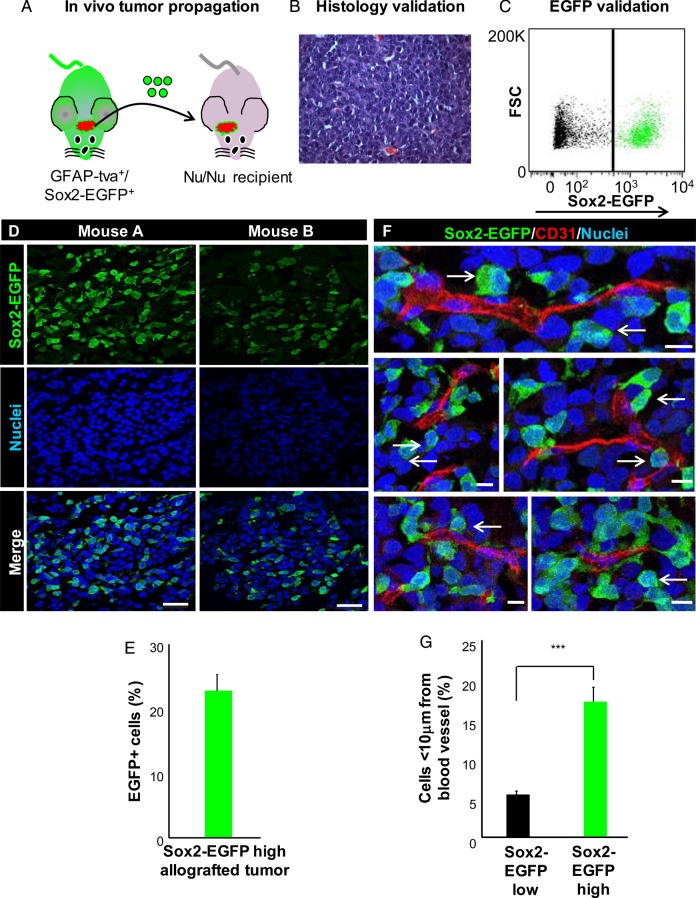
Fig. 2.
Sox2–EGFP-high glioma cells give rise to heterogeneous tumors and display perivascular localization. (A) Schematic demonstrating propagation of Sox2–EGFP-high glioma cells through intracranial injection into athymic nude mice to generate an allograft. (B) Representative histology of an allografted tumor showed by hematoxylin and eosin staining. (C) Analysis of tumor cells immediately after dissociation demonstrated that Sox2–EGFP-positive glioma cells make up a fraction of the bulk tumor. (D) Representative immunofluorescent images of allografts resulting from Sox2–EGFP-positive glioma cells. Images demonstrate intratumoral heterogeneity with respect to Sox2-EGFP expression. (E) Quantification of the percentage of Sox2–EGFP-high glioma cells in immunofluorescent images of tumor sections. (F) Representative immunofluorescent images demonstrating perivascular localization of Sox2–EGFP-high glioma cells in allografts. (G) Analysis of blood vessel proximity showing that Sox2–EGFP-high glioma cells preferentially associate with the tumor vasculature. Scale bar represents 50 µm for panel D and 10 µm for panel E. Data represent mean ± standard deviation, ***P < .001 as assessed by 1-way ANOVA.

