
Fig. 5.
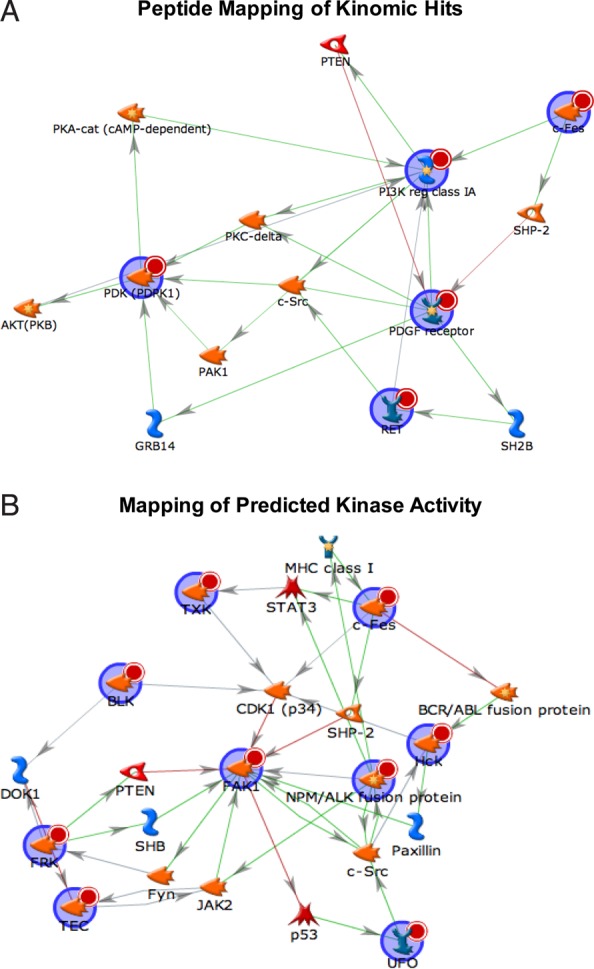
Kinomic analysis establishes active signaling networks in Sox2–EGFP-high cells. (A) Signaling map based on top hits from kinomic analysis. Proteins from the kinomic screen are denoted by a red circle, agonistic relationships are denoted by green arrows, and antagonistic relationships are denoted by a red arrow. (B) Map of kinase activity predicted by kinomic analysis.