

Abstract
Background
The introduction of antiretroviral therapy (ART) in the US and Europe has led to changes in the incidence of cancers among HIV- infected persons, including dramatic decreases in Kaposi sarcoma (KS) and non-Hodgkin lymphoma (NHL), and increases in Hodgkin lymphoma (HD), liver and anogenital malignancies. We sought to evaluate whether increasing availability of ART is associated with changing cancer incidence in Uganda.
Methods
Incident cases of 10 malignancies were identified from Kampala Cancer Registry from 1999 to 2008. ART coverage rates for Uganda were abstracted from UNAIDS reports. Negative binomial and poisson regression modeled the association between ART coverage and age-adjusted cancer incidence.
Results
ART coverage in Uganda increased from 0 to 43% from 1999 to 2008. With each 10% increase in ART coverage, incidence of Kaposi sarcoma decreased by 5%(incidence rate ratio [IRR]=0·95, 95% CI: 0·91–0·99, P=0·02) and stomach cancer decreased by 13% (IRR=0·87 [0·80–0·95], P=0·002). Conversely, incidence of non-Hodgkin lymphoma increased by 6% (IRR=1·06 [1–1·12], P=0·05), liver cancer by 12% (IRR=1·12 [1·04–1·21], P=0·002), prostate cancer by 5% (IRR=1·05 [1–1·10], P=0·05), and breast cancer by 5% (IRR=1·05 [1–1·11], P=0·05). ART coverage was not associated with incidence of invasive cervical cancer, lung, colon, and Hodgkin disease. These findings were similar when restricted to histologically confirmed cases.
Conclusion
Our findings suggest that AIDS-defining malignancies and other malignancies are likely to remain significant public health burdens in sub-Saharan Africa even as ART availability increases.
Keywords: Cancer incidence, HIV/AIDS, antiretroviral therapy, cancer in Africa, Uganda
Introduction
Cancer is a growing cause of morbidity and mortality in sub-Saharan Africa (sSA), fueled in part by the ongoing HIV epidemic 1–5. The incidence of several cancers, including Kaposi sarcoma (KS), invasive cervical cancer (ICC), non-Hodgkin’s lymphoma (NHL), prostate cancer, and squamous cell cancer of the conjunctiva increased markedly across sSA in the HIV/AIDS era 2, 6, 7. AIDS-defining malignancies (ADMs) – KS, ICC, and NHL – are now some of the leading causes of cancer in sSA 1. KS alone represents the commonest cancer in men and second commonest in women in several African countries 2. KS incidence increased by nearly 20-times with the advent of HIV in four sSA countries (Uganda, Malawi, Swaziland and Zimbabwe) reaching rates as high as 27.9/100,000 men and 20/100,000 women in Uganda in 2002–2006 2, 8. A growing body of evidence also suggests that other malignancies – designated “non-AIDS-defining malignancies” (NADMs) – including Hodgkin’s disease (HD), liver, anal and lung cancer, disproportionately affect HIV-infected individuals 9–14. In sSA, incidence of NADMs including prostate, breast and conjunctiva cancer increased in the HIV era in several Countries 2, 7. In Uganda the risk of NADMs, specifically as conjunctiva, kidney, thyroid and uterine cancers, were significantly higher in the HIV-infected individuals compared to the general population 3.
In North America and Europe, the widespread use of combination antiretroviral therapy (ART) led to declines in incidence of KS and NHL 11, 12, 15, 16. In the US, the proportion of HIV-infected individuals receiving ART rose from zero in 1995 to over 60% in 1998 17, concurrent with a nearly 3-fold decline in KS incidence from 14·7 cases per 100,000 person-years in 1992–1995 (pre-ART era) to 5·4 in 1996–1999 (ART era), and a decline in NHL incidence from 17·0 to 14·3 cases per 100,000 person-years in the general population11. Importantly, the incidence of some NADMs – including HD, liver, and anal cancer – increased in HIV-infected people in the US and Europe following the advent of ART 9–14. For example, the risk of HD increased by 68% among HIV-infected persons in the US in the ART era (1996–2002) compared to the pre-ART era (1990–1995) 12. The increased incidence of NADMs may be the result of improved survival of HIV-infected persons on ART, allowing for a longer time at risk for cancer development and an increase in the number of cancers that become clinically recognized 18, 19.
In Uganda and other countries in sSA, rapid scale-up of treatment of HIV with ART started in 2003 20. While the mass treatment programs have had tremendous impact on AIDS-related mortality 21–24, the effect of ART scale-up on cancer incidence in Africa is unknown. To address this gap, we sought to describe the changes in cancer incidence of both ADMs and NADMs in Uganda since the introduction of widespread ART.
Methods
We performed an ecological study to assess the impact of ART coverage on cancer incidence in Uganda from January 1999 to December 2008. We evaluated 10 cancers – the ADMs (KS, NHL, and ICC), and a subset of NADMs, including three with known infectious etiology (HD, liver, and stomach cancer) and four with no known infectious etiology (lung, breast, prostate, and colon cancer). The cancers studied were chosen a priori because they were among the commonest in the study population8.
Data sources
Cancer incidence data were obtained from the Kampala Cancer Registry, a population-based cancer registry in Uganda that has been in continuous operation since 1989 25. The Kampala Cancer Registry is recognized by the International Agency for Research on Cancer (IARC) and uses active case finding to document incident cancer cases in Kyadondo County in Uganda; it is estimated to include ≥90 percent of incident cases 25. Kyadondo County includes Uganda’s capital city, Kampala, and its suburbs. We obtained de-identified data on incident cases of cancer between January 1999 and December 2008 that included age, sex, date of diagnosis, basis of diagnosis, site, cancer morphology, and ICD-10 diagnostic coding. For breast cancer, only women were included. In parallel, we obtained the Uganda National Bureau of Statistics annual population estimates by age and sex for Kyadondo County to compute cancer rates in the area.
Annual country-level ART coverage estimates for the period 1999 to 2008 were obtained from the World Health Organization (WHO)/Joint United Nations Program on HIV/AIDS (UNAIDS) reports 20–23. ART coverage is expressed as annual cumulative number of people receiving ART divided by the estimated total number of people who qualify for it based on CD4 count and WHO staging of HIV/AIDS. The ART coverage rates used in these reports were based on the 2003 WHO criteria for initiating ART 26, corresponding to the period studied.
Statistical methods
We calculated the age-standardized incidence rate (ASR) using the direct method of standardization – we applied the observed age-specific incidence rates to the age-specific population sizes of the modified Segi World Standard Population 27, 28. We evaluated changes in the incidence rates for each cancer across the years studied and associations of ART coverage with cancer incidence using negative binomial and poisson models, with the number of incident cancer cases as the dependent variable and the natural logarithm of the population total as the offset. For cancers with overdispersed data, we used negative binomial models and for cancers that did not show evidence of overdispersion, we used poisson models with the scale parameter adjusted according to the deviance. Model estimates were presented as the annual percent change (APC), defined as incidence rate ratios (IRR) -1 multiplied by 100, for models estimating the average change in incidence over the years studied, and IRR for models evaluating associations between ART coverage and cancer incidence. For each cancer, we ran unadjusted models (representing crude cancer incidence) and age-adjusted models that adjusted for each 5-year age category. Calendar year was not included as an adjustment variable in the models examining the association between ART coverage and cancer incidence because it was highly collinear with ART coverage. A 2-sided p-value of <0.05 was considered significant. Analysis was done using Stata version 11.1 (StataCorp, College Station, TX).
Ethical review
The study concept was reviewed and received a waiver of IRB review from the Fred Hutchinson Cancer Research Center Institutional Review Board in Seattle, Washington; The School of Medicine Research and Ethics Committee at Makerere College of Health Sciences in Kampala, Uganda; and the Uganda National Council of Science and Technology.
Results
A total of 12,263 incident cancers were recorded between 1999 and 2008 in Kyadondo County, which had an estimated total population of 1·45 million people in 1999 and 2·17 million people in 2008. Of these total cancers, 8,322 (67·9%) were one of the 10 cancer of interest for this study; 186 cases (2.2%) lacked age information and were excluded. Of the remaining 8,136 cases, two thirds were ADM: 37% were KS, 18% ICC, and 11% NHL (Table 1). Among NADMs, the commonest cancers were breast (10·5%), prostate (7·5%), and liver (5·9%). Histological confirmation of cancer diagnosis was available for 94·1% of HD and 71·4% of KS cases, compared to 51·3% of ICC, 59.5% of NHL, 55·6% of breast and 47% of prostate cases. The proportion of histologically-confirmed cancer cases did not change significantly over time except for breast and lung cancer. Overall, the median age of patients was 39 years (range 0–98 years). The ADM cases were generally younger, particularly for KS (median 32 years; range, 0–90 years) and NHL (median 18 years; range, 0–97 years). Fifty eight percent of patients were female; the sex distribution was nearly equal for all cancer types other than breast, ICC and prostate.
Table 1.
Characteristics of cancer cases recorded in Kyadondo County, Uganda (1999 – 2008)
| Characteristic | AIDS defining malignancies N=5392(66·3%) |
Non-AIDS defining malignancies N=2744(33·7%) |
|||||||||
|---|---|---|---|---|---|---|---|---|---|---|---|
|
| |||||||||||
| Overall | KS | ICC | NHL | Breast | Prostate | Lung | Colon | Liver | Stomach | HD | |
|
| |||||||||||
| Number of Cases | 8,136 | 3, 018 | 1,488 | 886 | 853 | 610 | 192 | 177 | 481 | 278 | 153 |
| Diagnosis, (%) | |||||||||||
| Histology* | 58·9 | 71·4 | 51·3 | 59·5 | 55·6 | 47·0 | 47·4 | 41·8 | 33·9 | 39·6 | 94·1 |
| Clinical | 40·5 | 28·3 | 47·3 | 39·8 | 43·8 | 52·6 | 52·6 | 57·6 | 65·7 | 58·6 | 5·3 |
| Others** | 0·63 | 0·3 | 1·3 | 0·7 | 0·6 | 0·3 | 0 | 0·6 | 0·4 | 1·8 | 0·6 |
| Age, med (range) | 39 (0, 98) | 32 (0, 90) | 45 (20, 90) | 18 (0, 97) | 46 (19, 94) | 70 (27, 98) | 57 (1, 88) | 58 (4, 92) | 48 (1, 90) | 60 (7, 93) | 28 (1, 80) |
| Female, (%) | 58·2 | 46·1 | 100 | 43·9 | 100 | – | 45·8 | 54·2 | 45·1 | 49·3 | 45·8 |
ICC – Invasive cervical cancer; KS – Kaposi sarcoma; NHL – non-Hodgkin lymphoma; HD – Hodgkin disease; med – median; IQR – Inter quartile range
Includes 64 cases (24= breast, 22=NHL, KS=6 and others=12) diagnosed by cytology
Includes autopsy report and unknown basis of diagnosis
Age-adjusted cancer incidence decreased over the study period for KS (APC = −3·0%; 95% CI: −5.1% – −0·8%, p=0·007) and for stomach cancer (APC = −5·2%; 95% CI: −9.3% – −0·9%, p=0·02); this association with stomach cancer was attenuated (p=0·8) when we excluded the year 2008 in the analysis (Fig. 1). In contrast, the age-adjusted average annual percentage change for NHL was an increase of 4·7% (95% CI: 1·5% – 7·9%, p=0·004), and for liver cancer an increase of 7·2% (95% CI: 3·1% – 11·5%, p< 0·001). There were also increases in breast and prostate cancer with average annual percentage changes of 2·8% (95%: CI 0% – 5·7%, p=0·057) and 2·5% (95% CI: 0% – 5·1%, p=0·054) respectively, although these increases did reach statistical significance. There were no consistent linear trends in cancer incidence over the study period for ICC (p=0·25), HD (p=0·64), colon (p=0·76), and lung (p=0·44).
Fig. 1. Age Standardized Incidence Rate (ASR) per 100,000 person-years for individual cancers by year (1999–2008) in Uganda.

ICC – Invasive cervical cancer; KS – Kaposi sarcoma; NHL – non-Hodgkin lymphoma; HD – Hodgkin disease
ART become available in Uganda in 2001 and coverage increased from <1% in 2001 to 43% in 2008 (Fig. 2). Based on crude cancer incidence rates, there was a near significant association of ART coverage and NHL incidence, with an increase of 10% in the crude incidence of NHL for every 10% increase in ART coverage (IRR=1·10 per 10% increase in ART coverage, 95% CI: 0·99 to 1·22, p=0·08). There was no association between ART coverage and crude cancer incidence rates for KS, ICC, breast, prostate, lung, colon, stomach, HD and liver cancer (Table 2).
Fig. 2. Antiretroviral Coverage, by year (1999–2008), in Uganda.
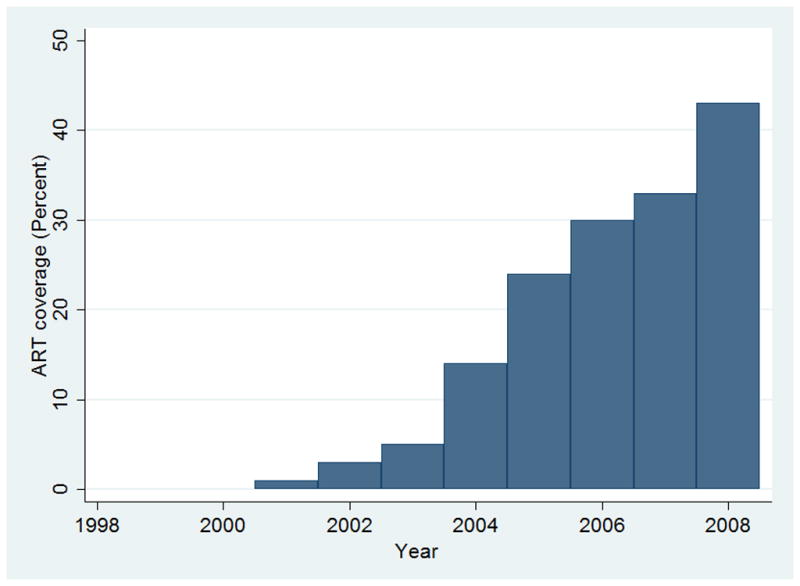
ART-Antiretroviral therapy
Table 2.
Changes in cancer incidence rate per 10% increase in ART coverage in Kyadondo County, Uganda (1999 – 2008)
| Cancer type | Cases recorded | Unadjusted Model | Age Adjusted Model | |||||
|---|---|---|---|---|---|---|---|---|
|
| ||||||||
| 1999 | 2008 | IRR | 95% CI | p-value | IRR | 95% CI | p-value | |
|
|
||||||||
| KS | 316 | 295 | 0·95 | 0·85 – 1·05 | 0·31 | 0·95 | 0·91 – 0·99 | 0·02 |
| ICC | 91 | 146 | 1·02 | 0·85 – 1·22 | 0·86 | 1·02 | 0·98 – 1·05 | 0·31 |
| NHL | 47 | 107 | 1·10 | 0·99 – 1·22 | 0·08 | 1·06 | 1·00 – 1·12 | 0·054 |
| HD | 10 | 20 | 0·93 | 0·79 – 1·09 | 0·37 | 0·94 | 0·84 – 1·05 | 0·28 |
| Liver | 26 | 55 | 1·16 | 0·95 – 1·40 | 0·14 | 1·12 | 1.04 – 1·21 | 0·002 |
| Stomach | 20 | 12 | 0·86 | 0·69 – 1·08 | 0·19 | 0·87 | 0·80 – 0·95 | 0·002 |
| Colon | 14 | 17 | 0·96 | 0·77 – 1·19 | 0·69 | 0·98 | 0·89 – 1·08 | 0·67 |
| Prostate | 40 | 65 | 1·05 | 0·80 – 1·37 | 0·75 | 1·05 | 1·00 – 1·10 | 0·048 |
| Breast * | 62 | 105 | 1·13 | 0·93 – 1·37 | 0·23 | 1·05 | 1·00 – 1·11 | 0·052 |
| Lung | 13 | 22 | 1·00 | 0·81 – 1·23 | 0·97 | 1·02 | 0·93 – 1·11 | 0·70 |
ART – antiretroviral therapy; IRR – Incidence Rate Ration; ICC- Invasive cervical cancer; KS – Kaposi sarcoma; NHL – Non-Hodgkin lymphoma; HD – Hodgkin disease.
In female population
After adjusting for age, we noted a significant association between ART coverage and incidence of KS, stomach, liver, and prostate cancer. For every 10% increase in ART coverage, KS incidence decreased by 5% (IRR = 0·95, 95% CI: 0·91 – 0·99, p = 0·02), and stomach cancer incidence decreased by 13% (IRR = 0·87, 95% CI: 0·80 – 0·95, p=0.002), while liver incidence increased by 12% (IRR = 1·12, 95% CI: 1·01 – 1·21, p=0·002) and prostate cancer increased by 5% (IRR = 1·05, 95% CI: 1·0 – 1.10, p = 0·048). Of note, the decrease in incidence of stomach cancer lost significance when the year 2008 was omitted (p=0·84). We also found near significant associations between ART coverage and incidence of NHL and breast cancer. For every 10% increase in ART coverage, NHL incidence increased by 6% (IRR = 1·06, 95% CI: 1·0 – 1·12, p = 0·054), and female breast cancer incidence increased by 5% (IRR = 1·05, 95% CI: 1·0 – 1·11, p = 0·052). No association was observed between ART coverage and incidence of ICC, lung, colon, and HD in age-adjusted models. When we restricted the analysis to histologically confirmed diagnoses, we observed a similar significant decrease for KS (p=0·004) and increases in liver cancer (p=0·003) and prostate cancer (p=0·02), but the associations with NHL (p=0·28), stomach (p=0·15) and breast (p=0·12) were no longer statistically significant. We also observed significant decreases in incidence of ICC and lung cancer (Table 3).
Table 3.
Changes in cancer incidence rate per 10% increase in ART coverage for histologically confirmed diagnoses in Kyadondo County, Uganda (1999 – 2008)
| Cancer type | Cases recorded | Unadjusted Model | Age Adjusted Model | |||||
|---|---|---|---|---|---|---|---|---|
|
| ||||||||
| 1999 | 2008 | IRR | 95% CI | p-value | IRR | 95% CI | p-value | |
|
|
||||||||
| KS | 252 | 237 | 0·93 | 0·84 – 1·04 | 0·20 | 0·93 | 0·89 – 0·98 | 0·004 |
| ICC | 67 | 97 | 0.96 | 0·79 – 1·15 | 0·65 | 0·96 | 0·92 – 1·00 | 0·045 |
| NHL | 43 | 66 | 1·02 | 0·91 – 1·14 | 0·72 | 0.97 | 0·91 – 1·03 | 0·28 |
| HD | 10 | 15 | 0·9 | 0·75 – 1·08 | 0·25 | 0·90 | 0·80 – 1·02 | 0·09 |
| Liver | 20 | 32 | 1·34 | 1·08 – 1·67 | 0·008 | 1·17 | 1.05 – 1·30 | 0·003 |
| Stomach | 16 | 6 | 0·91 | 0·72 – 1·14 | 0·40 | 0·91 | 0·81 – 1.03 | 0·15 |
| Colon | 10 | 10 | 0·93 | 0·74 – 1·18 | 0·56 | 0·95 | 0·83 – 1·09 | 0·46 |
| Prostate | 29 | 44 | 1·07 | 0·82 – 1·41 | 0·61 | 1·08 | 1·01 – 1·14 | 0·02 |
| Breast * | 54 | 55 | 1·01 | 0·84 – 1·23 | 0·89 | 0·95 | 0·89 – 1·01 | 0·12 |
| Lung | 11 | 10 | 0·85 | 0·67 – 1.07 | 0·17 | 0·85 | 0·75 – 0·97 | 0·02 |
ART – antiretroviral therapy; IRR – Incidence Rate Ration; ICC- Invasive cervical cancer; KS – Kaposi sarcoma; NHL – Non-Hodgkin lymphoma; HD – Hodgkin disease.
In female population
Discussion
To our knowledge, this study is the first to assess the impact of ART on cancer incidence using ecological data in sSA. We found that ADMs contribute significantly to the cancer burden in Uganda, and that the rates of these malignancies have not decreased substantially in the era of increased ART coverage.
Increasing ART coverage was associated with a decrease in KS in Uganda, but the change was modest compared to that observed in US and Europe 11. The smaller impact of ART on KS incidence in Uganda may be explained by several factors: 1) ART was generally initiated at a lower CD4 count cut-off (CD4<200) in Uganda than in the US 29, perhaps resulting in poorer immune recovery and less effective immune surveillance against Kaposi Sarcoma herpesvirus and early KS; 2) Overall ART coverage in Uganda was lower than the US, resulting in a larger proportion of HIV-infected Ugandans remaining at risk for developing KS before starting ART 17, 21–23; 3) the use of different ART regimens in Uganda, including the less frequent use of protease inhibitors, which may have a differential impact on HIV suppression and KS development 17, 24; 4) differences in ART adherence, although estimated rate of adherence to ART in Uganda is 97% compared to 72% in the US 30, 31; and 5) inherent differences in the biology and epidemiology of KS in Uganda, where KS was endemic in the population before the advent of HIV 2. The low incidence of endemic KS (ASR 2.1 per 100,000 person years) in Kyadondo County in the pre-HIV era7, suggests that endemic KS accounted for about 8.8% of KS cases in our study comparable to findings in Mozambique 32. Although KS incidence had been declining with decreasing HIV prevalence in Uganda up to 2001, HIV prevalence remained relatively stable throughout the study period, when ART became available in Uganda 33. Therefore, the association between increased ART coverage and decreased incidence of KS we observed is unlikely to be a reflection of temporal trends in KS incidence related to HIV prevalence.
In contrast to the decrease seen in US and Europe 10, 11, we observed a slight increase in NHL incidence with increasing ART availability in Uganda. The majority of NHL cases were endemic Burkitt lymphoma (BL) and account for the low median age of NHL patients in our study population. BL is the commonest NHL subtype among children in Uganda and has not been shown to be associated with HIV/AIDS. After excluding BL cases in children under 15 years of age in our cohort, the observed increases in NHL incidence did not change (data not shown). When limited to histologically confirmed NHL cases, the observed association between NHL and increasing ART was attenuated, suggesting no statistically significant change in NHL incidence over the period of ART scale-up. Increasing ART coverage had no impact on overall ICC incidence, similar to observations in other regions of the world 10, 11, but there was a marginal decrease in histologically confirmed cases. However, the observation period in our study was probably too short to expect to detect a change in incidence of ICC, which develops over a much longer period. More likely, prevalent cases of irreversible microscopic malignant changes in the cervix at the advent of ART in Uganda continue to contribute to clinically overt ICC cases in the ART era. Also, the high burden of ICC in the non-HIV infected population in Uganda may have limited any change in ICC incidence with widespread use of ART 1, 2. In the long term, ART uptake may not change the incidence of ICC given the uncertainty of whether treatment with ART impacts HPV clearance and premalignant lesions in the cervix among HIV-infected women 34.
Among the NADMs, we found that increasing ART coverage was associated with an increase in breast cancer incidence, prostate cancer and liver cancer, and a decrease in stomach cancer incidence. The increase in breast and prostate cancers may be attributed to improved survival among HIV-infected individuals treated with ART 22–24, or alternatively increased awareness and ascertainment of these cancers leading to more common diagnoses in both HIV-positive and HIV–negative women. A cancer linkage study in Uganda during the pre-ART era found that HIV-infected women had a 90% increase in incidence of breast cancer compared to the general population 35, suggesting either a biologic relationship between HIV and breast cancer or an increase in breast cancer detection among women more actively engaged with the healthcare system. The finding that stomach cancer incidence decreased among Ugandans was unexpected and likely driven by cancer incidence in 2008. Most stomach cancers are attributed to infection with Helicobacter pylori, with a small percentage related to infection with EBV. CD4+ T-lymphocytes may be important in the pathogenesis of stomach cancer 36, and it could be expected that T-cell repletion with immune reconstitution in HIV-positive individuals on ART predisposes to a higher risk of stomach cancer. The changing incidence of many other NADMs has been reported among HIV-infected individuals across studies in Europe and US 9–14. The most consistent increase has been reported for HD. The lack of change in HD incidence with increasing ART use in Uganda may be due to under reporting or misdiagnosis as NHL in the Ugandan setting.
Our findings may be limited by inability to control for factors known to impact cancer risk such as parity, tobacco use, and improved access to cancer diagnosis facilities that may have contributed to the changes in cancer incidence. It is possible that there may be secular trends, but given the relatively short observation period, we feel those are unlikely to have substantial impacts on our findings. Also, we lacked ART coverage information specific for Kyadondo County and HIV status information for the cancer cases in the KCR; consequently direct assessment for changes in cancer incidence in HIV-infected individuals could not be performed. When we restricted the analysis to cases with histological confirmation we observed similar results for KS, liver, and prostate cancer, but associations with NHL, breast, and stomach were attenuated probably because of the smaller number of cases included.
Despite these limitations, our study demonstrated changes in incidence of several cancers over a ten-year period in which ART coverage among HIV-infected persons increased substantially. However, these changes in cancer incidence were modest, suggesting that ADMs are likely to continue to represent a significant public health burden in sSA even as ART availability increases. The impact of ART on ADM incidence in sSA may be greater if recommendations by WHO to begin HIV infected persons on ART at higher CD4 counts are widely implemented. However, people living with HIV/AIDS in sSA are likely to remain at much higher risk for ADMs compared to other parts in the world, given the high seroprevalence of many oncogenic viruses in this population and the high incidence of several cancers prior the HIV pandemic. Therefore additional interventions, such as screening and vaccination, should be evaluated in HIV-infected people since they represent a high risk group. Further studies of individual-level data in cancer incidence in HIV infected individuals on ART in sSA are needed to corroborate these findings.
Acknowledgments
The authors acknowledge Anna Wald for reviewing the draft manuscript; the staff of Kampala Cancer Registry for compiling and sharing data; The National Institutes of Health in US for funding and training through the NIH’s building sustainable research teams in HIV-associated malignancies (D43 CA153720), and AIDS International Training and Research Program Project on HIV-associated malignancies at the University and Washington and Fred Hutchinson Cancer Research Center, Seattle US (D43 TW000007).
Footnotes
Conflicts of interest:
There were no conflicts of interest declared.
CC conceived the study; CC, IM, WP and JG designed the study and acquired the data. IM and EK analyzed and interpreted the data. IM and WP drafted the manuscript. CC, JG, EK, AW, JO, WH, and SN critically revised the manuscript. All authors saw and approved the final version of the paper.
References
- 1.Ferlay J, Shin HR, Bray F, Forman D, Mathers C, Parkin DM. Estimates of worldwide burden of cancer in 2008: GLOBOCAN 2008. Int J Cancer. 2010;127(12):2893–2917. doi: 10.1002/ijc.25516. [DOI] [PubMed] [Google Scholar]
- 2.Parkin DM, Sitas F, Chirenje M, Stein L, Abratt R, Wabinga H. Part I: Cancer in indigenous africans--burden, distribution, and trends. Lancet Oncol. 2008;9(7):683–692. doi: 10.1016/S1470-2045(08)70175-X. [DOI] [PubMed] [Google Scholar]
- 3.Mbulaiteye SM, Katabira ET, Wabinga H, et al. Spectrum of cancers among HIV-infected persons in Africa: The uganda AIDS-cancer registry match study. Int J Cancer. 2006;118(4):985–90. doi: 10.1002/ijc.21443. [DOI] [PubMed] [Google Scholar]
- 4.Coghill AE, Newcomb PA, Madeleine MM, et al. Contribution of HIV infection to mortality among cancer patients in uganda. Aids. 2013 doi: 10.1097/01.aids.0000433236.55937.cb. [DOI] [PMC free article] [PubMed] [Google Scholar]
- 5.Casper C. The increasing burden of HIV-associated malignancies in resource-limited regions. Annu Rev Med. 2011;62:157–170. doi: 10.1146/annurev-med-050409-103711. [DOI] [PubMed] [Google Scholar]
- 6.Wabinga H, Parkin DM, Sitas F, Wabwire-Mangen F, Mugerwa W. Cancer in Kampala, Uganda, in 1989–91: Changes in the incidence in the era of AIDS. Int J Cancer. 1993;54:26–36. doi: 10.1002/ijc.2910540106. [DOI] [PubMed] [Google Scholar]
- 7.Wabinga HR, Parkin DM, Wabwire-Mangen F, et al. Trends in cancer incidence in Kyadondo County, Uganda, 1960–1997. Br J Cancer. 2000;82:1585–92. doi: 10.1054/bjoc.1999.1071. [DOI] [PMC free article] [PubMed] [Google Scholar]
- 8.Parkin DM, Nabooze s, Wabwire-Magen F, et al. Changing cancer incidence in Kampala, Uganda, 1991–2006. Int J Cancer. 2010;126:1187–1197. doi: 10.1002/ijc.24838. [DOI] [PubMed] [Google Scholar]
- 9.Bedimo RJ, McGinnis KA, Dunlap M, Rodriguez-Barradas MC, Justice AC. Incidence of non-AIDS-defining malignancies in HIV-infected versus noninfected patients in the HAART era: Impact of immunosuppression. J Acquir Immune Defic Syndr. 2009;52(2):203–8. doi: 10.1097/QAI.0b013e3181b033ab. [DOI] [PMC free article] [PubMed] [Google Scholar]
- 10.Calabresi A, Ferraresi A, Festa A, et al. Incidence of AIDS-defining cancers and virus-related and non-virus-related non-AIDS-defining cancers among HIV-infected patients compared with the general population in a large health district of northern Italy, 1999–2009. HIV Med. 2013;14(8):481–90. doi: 10.1111/hiv.12034. [DOI] [PubMed] [Google Scholar]
- 11.Patel P, Hanson DL, Sullivan PS, et al. Incidence of types of cancer among HIV-infected persons compared with the general population in the United States, 1992–2003. Ann Intern Med. 2008;148(10):728–36. doi: 10.7326/0003-4819-148-10-200805200-00005. [DOI] [PubMed] [Google Scholar]
- 12.Engels EA, Pfeiffer RM, Goedert JJ, et al. Trends in cancer risk among people with AIDS in the United States 1980–2002. AIDS. 2006;20(12):1645–54. doi: 10.1097/01.aids.0000238411.75324.59. [DOI] [PubMed] [Google Scholar]
- 13.Franceschi S, Lise M, Clifford GM, et al. Changing patterns of cancer incidence in the early- and late-HAART periods: The swiss HIV cohort study. Br J Cancer. 2010;103(3):416–22. doi: 10.1038/sj.bjc.6605756. [DOI] [PMC free article] [PubMed] [Google Scholar]
- 14.Polesel J, Franceschi S, Suligoi B, et al. Cancer incidence in people with AIDS in Italy. Int J Cancer. 2010;127(6):1437–1445. doi: 10.1002/ijc.25153. [DOI] [PubMed] [Google Scholar]
- 15.Grulich AE, van Leeuwen MT, Falster MO, Vajdic CM. Incidence of cancers in people with HIV/AIDS compared with immunosuppressed transplant recipients: A meta-analysis. Lancet. 2007;370(9581):59–67. doi: 10.1016/S0140-6736(07)61050-2. [DOI] [PubMed] [Google Scholar]
- 16.Eltom MA, Jemal A, Mbulaiteye SM, Devesa SS, Biggar RJ. Trends in kaposi’s sarcoma and non-hodgkin’s lymphoma incidence in the United States from 1973 through 1998. J Natl Cancer Inst. 2002;94(16):1204–10. doi: 10.1093/jnci/94.16.1204. [DOI] [PubMed] [Google Scholar]
- 17.Kaplan JE, Hanson D, Dworkin MS, et al. Epidemiology of human immunodeficiency virus-associated opportunistic infections in the United States in the era of highly active antiretroviral therapy. Clin Infect Dis. 2000;30 (Suppl 1):S5–14. doi: 10.1086/313843. [DOI] [PubMed] [Google Scholar]
- 18.Lohse N, Hansen AB, Pedersen G, et al. Survival of persons with and without HIV infection in denmark, 1995–2005. Ann Intern Med. 2007;146(2):87–95. doi: 10.7326/0003-4819-146-2-200701160-00003. [DOI] [PubMed] [Google Scholar]
- 19.Palella FJ, Jr, Delaney KM, Moorman AC, et al. Declining morbidity and mortality among patients with advanced human immunodeficiency virus infection. HIV outpatient study investigators. N Engl J Med. 1998;338(13):853–860. doi: 10.1056/NEJM199803263381301. [DOI] [PubMed] [Google Scholar]
- 20.Progress on global access to HIV antiretroviral therapy: A report on” 3 by 5” and beyond. World Health Organization; Mar, 2006. Available at http://www.who.int/hiv/fullreport_en_highres.pdf. [Google Scholar]
- 21.Towards universal access: Scaling up priority HIV/AIDS interventions in the health sector: Progress report. WHO and UNICEF; Apr, 2007. Available at http://www.who.int/hiv/mediacentre/universal_access_progress_report_en.pdf. [Google Scholar]
- 22.Towards universal access : Scaling up priority HIV/AIDS interventions in the health sector : Progress report. WHO, UNAIDS, and UNICEF; 2008. Available at http://whqlibdoc.who.int/publications/2008/9789241596886_eng.pdf. [Google Scholar]
- 23.Towards universal access: Scaling up priority HIV/AIDS interventions in the health sector: Progress report. WHO, UNAIDS, and UNICEF; 2009. Available at http://whqlibdoc.who.int/publications/2009/9789241598750_eng.pdf. [Google Scholar]
- 24.Kasamba I, Baisley K, Mayanja BN, Maher D, Grosskurth H. The impact of antiretroviral treatment on mortality trends of HIV-positive adults in rural Uganda: A longitudinal population-based study, 1999–2009. Trop Med Int Health. 2012;17(8):e66–73. doi: 10.1111/j.1365-3156.2012.02841.x. [DOI] [PMC free article] [PubMed] [Google Scholar]
- 25.Parkin DM, Wabinga H, Nambooze S. Completeness in an African cancer registry. Cancer Causes Control. 2001;12(2):147–52. doi: 10.1023/a:1008966225984. [DOI] [PubMed] [Google Scholar]
- 26.Treat 3 Million by 2005 Initiative: ARV treatment guidelines and technical and operational recommendations for ART. World Health Organization; 2003. Available at http://whqlibdoc.who.int/hq/2003/WHO_HIV_2003.18.pdf. [Google Scholar]
- 27.Doll R, Payne P, Waterhouse J, editors. Cancer Incidence in Five Continents. 1. Geneva: Union Internationale Contre le Cancer; 1966. [Google Scholar]
- 28.Segi M. Cancer mortality for selected sites in 24 countries (1950–57) Department of Public Health, Tohoku University of Medicine; Sendai, Japan: 1960. [Google Scholar]
- 29.Lahuerta M, Ue F, Hoffman S, et al. The problem of late ART initiation in sub-Saharan Africa: A transient aspect of scale-up or a long-term phenomenon. J Health Care Poor Underserved. 2013;24(1):359–383. doi: 10.1353/hpu.2013.0014. [DOI] [PMC free article] [PubMed] [Google Scholar]
- 30.Shumba C, Atuhaire L, Imakit R, Atukunda R, Memiah P. Missed doses and missed appointments: Adherence to ART among adult patients in uganda. International Scholarly Research Notices. 2013;2013 doi: 10.1155/2013/270914. [DOI] [PMC free article] [PubMed] [Google Scholar]
- 31.Lucas GM, Chaisson RE, Moore RD. Highly active antiretroviral therapy in a large urban clinic: Risk factors for virologic failure and adverse drug reactions. Ann Intern Med. 1999;131(2):81–87. doi: 10.7326/0003-4819-131-2-199907200-00002. [DOI] [PubMed] [Google Scholar]
- 32.Meireles P, Albuquerque G, Vieira M, et al. Kaposi sarcoma incidence in Mozambique: National and regional estimates. Eur J Cancer Prev. 2014 doi: 10.1097/CEJ.0000000000000108. [DOI] [PubMed] [Google Scholar]
- 33.Musinguzi J, Kirungi W, Akol Z, Opio A, Biryahwaho B, Mulumba N. The HIV/AIDS surveillance report. Uganda Ministry Of Health; 2010. Available at http://www.unaids.org/en/media/unaids/contentassets/documents/data-and-analysis/tools/spectrum/Uganda2011report.pdf. [Google Scholar]
- 34.Bratcher LF, Sahasrabuddhe VV. Review the impact of antiretroviral therapy on HPV and cervical intraepithelial neoplasia: Current evidence and directions for future research. 2010. [DOI] [PMC free article] [PubMed] [Google Scholar]
- 35.Mbulaiteye SM, Buonaguro FM. Infections and cancer: Debate about using vaccines as a cancer control tool. Infect Agent Cancer. 2013;8(1):16. doi: 10.1186/1750-9378-8-16. [DOI] [PMC free article] [PubMed] [Google Scholar]
- 36.Sayi A, Kohler E, Hitzler I, et al. The CD4+ T cell-mediated IFN-gamma response to helicobacter infection is essential for clearance and determines gastric cancer risk. J Immunol. 2009;182(11):7085–7101. doi: 10.4049/jimmunol.0803293. [DOI] [PubMed] [Google Scholar]