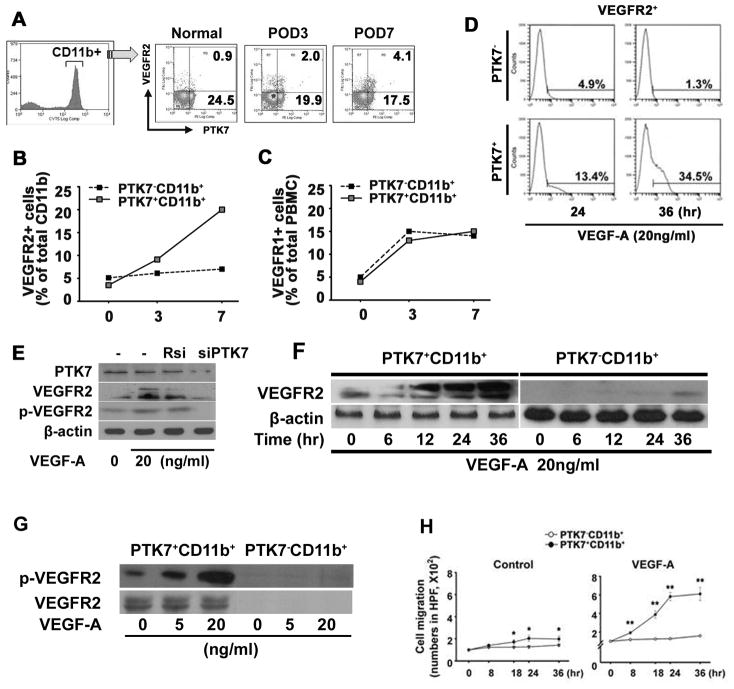
Figure 2. VEGFR2 expression and migration of PTK7+ CD11b+ cells is induced by VEGF-A.
VEGF-A corneal pellets were implanted in 6-week-old Balb/c mice (n=7) and mice were analyzed before implantation (Control, day 0) and at postoperative days (POD) 3 and 7. Peripheral blood mononuclear cells (PBMCs) were stained with monoclonal anti-mouse PTK7-PE-, CD11b-FITC-, and VEGFR2-APC-conjugated antibodies. Frequencies of VEGFR2+PTK7+ were measured in CD11b+ cells on POD 0, 3, and 7 using flow cytometry (A). VEGFR2- (B) and VEGFR1- (C) expression was compared between PTK7+CD11b+ or PTK7−CD11b+ cells by flow cytometry at POD 0, 3, and 7. D, Representative flow analysis histogram shows VEGFR2+ cell frequencies on PTK7+CD11b+ and PTK7−CD11b+ cells (1.2 x 10⁵ cells/well) 24 and 36 hours after VEGF-A stimulation (20ng/ml). VEGFR2 expression was measured by flow analysis. E, Expression of VEGFR2 by PTK7 siRNA (siPTK7) transfection was determined. After transfection of siPTK7 or random siRNA (Rsi), VEGF-A (20ng/ml) was treated for 24 hours then, the expression of VEGFR2 and phospho-VEGFR2 was measured by immunoblot. F, PTK7−CD11b+ and PTK7+CD11b+ cells were stimulated with VEGF-A (20 ng/ml) for 0 to 36 hours and the expression of VEGFR2 protein was measured by western blot. G. Phosphorylated VEGFR2 (Tyr951, 7H11) was compared between PTK7+CD11b+ and PTK7−CD11b+ cells by immunoblot at 1, 5, and 15 minutes after VEGF-A stimulation (20 ng/ml). H, PTK7−CD11b+ (white dot) and PTK7+CD11b+ (black dot) PBMCs were separated using flow cytometry and cell migration was determined in a time-dependent manner using a transwell assay. 8×10⁴ PTK7+CD11b+ and PTK7−CD11b+ PBMCs were seeded in the upper chamber, with or without VEGF-A (20 ng/ml). The cells that migrated to the bottom of the lower chamber were stained with hematoxylin and counted using an inverted microscope. All experiments were repeated four times. Data are expressed as the mean ± standard deviation. *p < 0.05; **p < 0.01.

