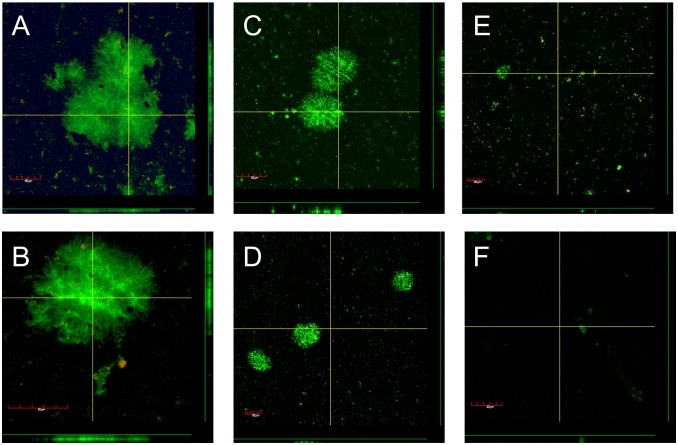
Fig 3. Confocal images of P. aeruginosa biofilms cells after argon plasma treatment stained with BacLight Live/Dead.
Viable cells are stained green and dead cells are stained red A) Untreated control, B) 10 min argon gas control, C) 1 min plasma, D) 3 min plasma, E) 5 min plasma and F) 10 min plasma treatment. Each image shows a representative horizontal section (main picture), and two vertical sections (to the right of and below the green lines on the right-hand side and bottom of the main picture, respectively). The vertical sections correspond to the two yellow lines in the main picture.

