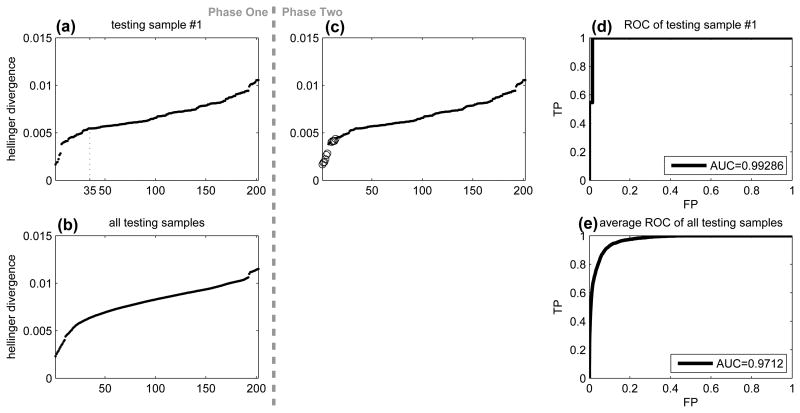
Figure 3.
Hellinger divergence for predicting samples processed by the same lab. (a) Sorted Hellinger divergence between testing sample #1 and the training samples. (b) Average of panel (a) for all testing samples. (c) Duplicate of panel (a) with training samples from the same lab of testing sample #1 highlighted as circles. (d) ROC of Hellinger divergence to identify training samples from the same lab as testing sample #1. (e) Average ROC for all testing samples.

