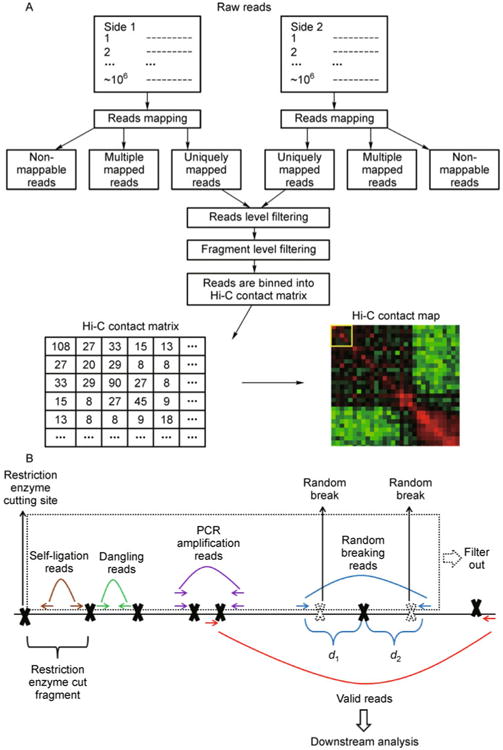
Figure 3. The Hi-C data preprocessing procedure.

(A) Flowchart of the Hi-C data preprocessing procedure; (B) An illustration of reads level filtering. The solid black line represents a genomic region of interest. Solid black crosses represent the restriction enzyme cutting site. The genomic region between any two adjacent restriction enzyme cutting sites is the restriction enzyme cut fragment (fragment in short). The paired-end reads in which both sides can be uniquely mapped to the reference genome can be divided into the following groups. If both sides of a paired-end reads are mapped within the same fragment, according to the directions of two sides, they are either self-ligation reads (brown arrows) or dangling reads (green arrows). Multiple paired-end reads may be mapped to the exactly same genomic location (purple arrows), possibly due to the PCR amplification artifact. If the sum of two reads to the nearest restriction enzyme cutting site (d1+ d2) is larger than the Hi-C library maximum (usually 500 bp), they (blue arrows) are probably due to random breaking (dashed black crosses) in the middle of a fragment. After filtering out self-ligation reads, dangling reads, PCR amplification reads and random breaking reads (the reads in the dashed box), the remainder (red arrows) are defined as the valid reads for the downstream analysis.
