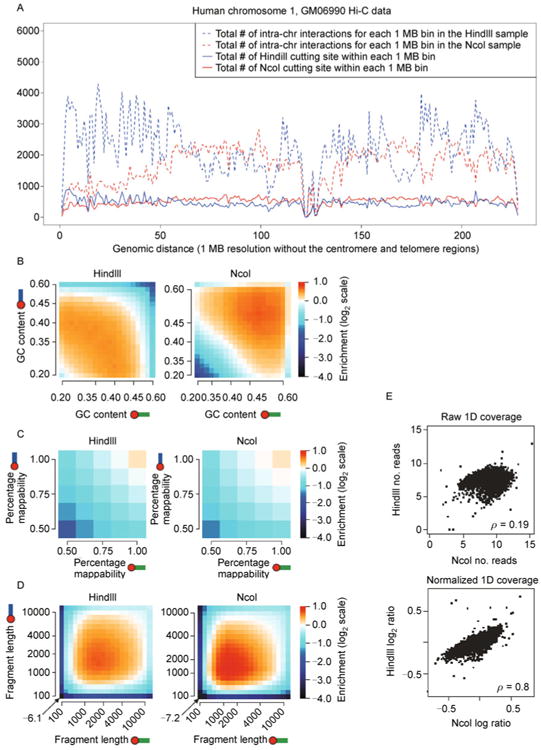
Figure 4. Multiple sources of systematic biases buried in Hi-C experiments.

(A) The restriction enzyme bias. We use the Hi-C data on human GM06990 cells [34] as an example. The red solid curve and the blue solid curve represent the total number of restriction enzyme cutting site within each 1 MB bin in the human chromosome 1 for the restriction enzyme HindIII and the restriction enzyme NcoI, respectively. The restriction enzyme cutting sites are not uniformly distributed along the human chromosome 1. The cutting site distributions of HindIII and NcoI (the red solid curve and the blue solid curve) are weakly correlated (Pearson correlation coefficient = 0.1496). The red dashed curve and the blue dashed curve represent the total number of intra-chromosomal interactions for each 1 MB (row sum in the Hi-C contact matrix) in the human chromosome 1 for the HindIII sample and the NcoI sample, respectively. The row sums in the HindIII sample and the NcoI sample (the red dashed curve and the blue dashed curve) are poorly correlated (Pearson correlation coefficient = −0.0283). Chromosome regions with more restriction enzyme cutting sites tend to show a higher level of chromatin interactions. Row sum in the Hi-C contact matrix and the restriction enzyme cutting site distribution are highly correlated (Pearson correlation coefficient = 0.9268 in the HindIII sample, 0.9321 in the NcoI sample). Noticeably, the restriction enzyme bias is specific to the enzyme used in Hi-C experiments, since different enzymes have different cutting site densities. (B) The GC content bias (direct copy of Ref. [73], Figure 1f). Lighter color represents enriched chromatin interactions, while darker color represents depleted chromatin interactions. Noticeably, the GC content is specific to the enzyme used in Hi-C experiments, since different enzyme cutting sites have different GC contents. (C) The mappability bias (direct copy of Ref. [73], Figure 1h). Lighter color represents enriched chromatin interactions, while darker color represents depleted chromatin interactions. Noticeably, the mappability bias is similar for Hi-C experiments with different restriction enzymes. (D) The fragment length bias (direct copy of Ref. [73], Figure 1d). Lighter color represents enriched chromatin interactions, while darker color represents depleted chromatin interactions. Noticeably, the fragment length bias is similar for Hi-C experiments with different restriction enzymes. (E) Effectiveness of the Yaffe and Tanay's method [73] in Hi-C bias reduction (direct copy of Ref. [73], Figure 2d). 1D coverage profile is defined as the total number of inter-chromosome interactions involving each of the 1 MB chromosomal bins. The raw 1D coverage profiles between the HindIII sample and the NcoI sample are weakly correlated (Spearman correlation coefficient = 0.19). The normalized 1D coverage profiles between the HindIII sample and the NcoI sample are highly correlated (Spearman correlation coefficient = 0.8).
