
Fig. 2.
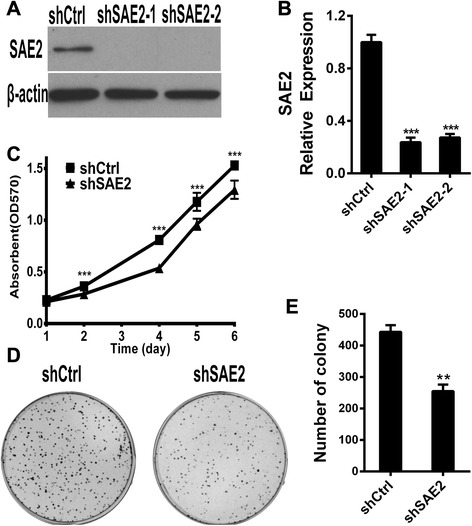
SAE2 affects the proliferation of SCLC cell line. Knockdown of SAE2 in H446 cell line confirmed by Western blot (a) and real-time PCR (b). c Growth rate of H446 cells with or without knockdown of SAE2 was determined by MTT assay. Data shown are means ± SD of three independent experiments. Representative colony images (d) and quantification of colony (e) are shown with or without knockdown of SAE2. Data are presented as means ± SD of three independent experiments (**P < 0.01, ***P < 0.001)