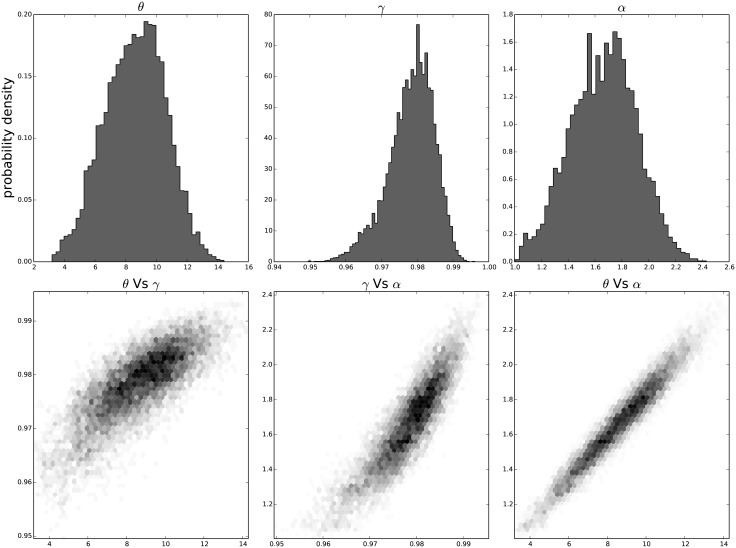
Fig 11. The distribution of the parameters (α, θ and γ) for the tenth passage estimated with bayesian analysis.
In the first line we have the distribution of each parameter. In the second line we have the joint probability distribution of each couple. This show that the values are correlated but without strong non–linearity.

