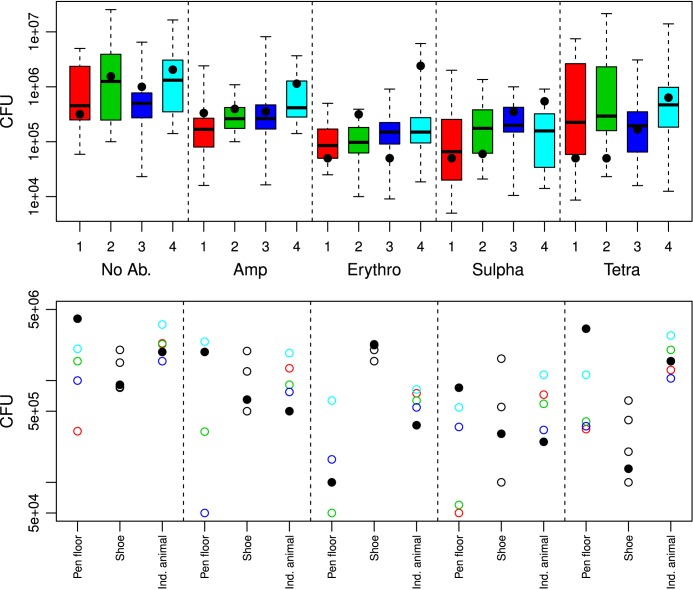
Fig 1. Sampling 1 coliform bacteria CFUs g-1 feces in individual animals within pens 1–4.
Top: Boxplot showing the distribution of the coliform bacteria CFUs from sampling 1 in individual animals within pens 1–4 (pen 1, red, n = 22; pen 2, green, n = 20; pen 3, purple, n = 22; pen 4, blue, n = 20) on MacConkey plates (No Ab. = no antibiotics, Amp = ampicillin, Erythro = erythromycin, Sulpha = sulphonamide, Tetra = tetracycline). The bottom and top of the boxes are the first and third quartiles, respectively. The black band inside the box is the median and the “dotted-whiskers” represent the maximum (greatest CFU number values, excluding outliers) and minimum (lowest CFU value, excluding outliers). The solid circles are the individual animal pool pen samples within each pen. Bottom: The distribution of coliform bacteria CFUs from different sampling and pooling methods from sampling 1. The sampling methods are given under the bottom (Pen floor = pen floor sample; Shoe = shoe cover sample; Ind. animal = Individual animal sample). Each pen is represented by their colored circle (pen 1, red circle; pen 2, green circle; pen 3, purple circle; pen 4, blue circle), and the corresponding stable pools are solid black circles. The individual shoe cover samples are empty black circles, and the corresponding stable pool is a solid black circle.

