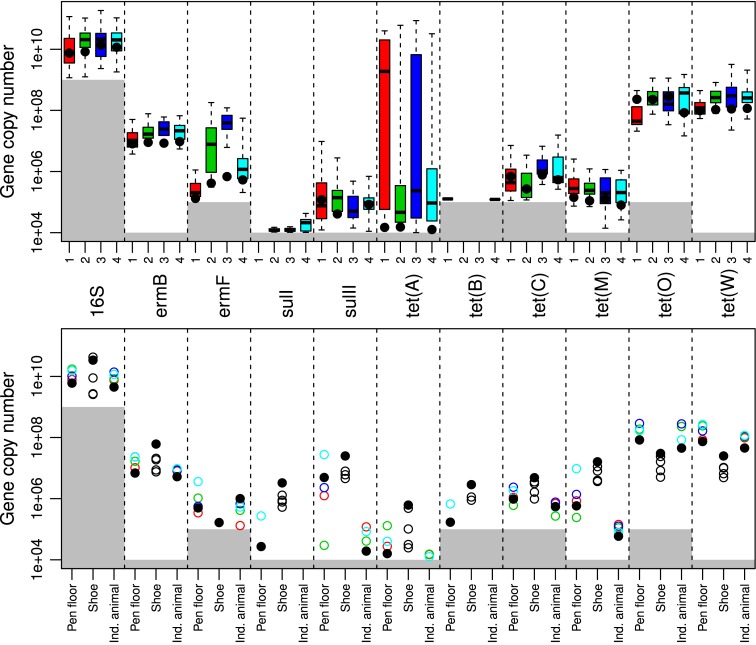
Fig 2. Sampling 1 gene copy numbers g-1 feces in individual animals within pens 1–4.
Top: Boxplot showing the distribution of gene copies above the limit of quantification, LOQ (grey area = below LOQ) for individual animals within pens 1–4 from sampling 1 (pen 1, red, n = 22; pen 2, green, n = 20; pen 3, purple, n = 22; pen 4, blue, n = 20). The bottom and top of the boxes are the first and third quartiles, respectively. The black band inside the box is the median and the “dotted-whiskers” represent the maximum (greatest gene copy number values, excluding outliers) and minimum (least gene copy number value, excluding outliers). The solid circles are the individual animal pool pen samples within each pen. Each column represents a denoted gene (the respective genes are depicted in the middle of the figure and are shared for the top and bottom section of Fig 2). Bottom: The distribution of gene copies above the LOQ (grey area = below LOQ) for different sampling and pooling methods from sampling 1. The sampling methods are given under the bottom figure (Pen floor = pen floor sample; Shoe = shoe cover sample; Ind. animal = Individual animal sample). Each pen is represented by their colored circle for the pen floor and Ind. animal samples (pen 1, red circle; pen 2, green circle; pen 3, purple circle; pen 4, blue circle). The shoe cover samples are the same 4 shoe covers that were used in all 4 pens (individual shoe cover samples are empty black circles). The stable pools of the respective sampling method, pen floor, shoe cover, Ind. animal, are solid black circles.

