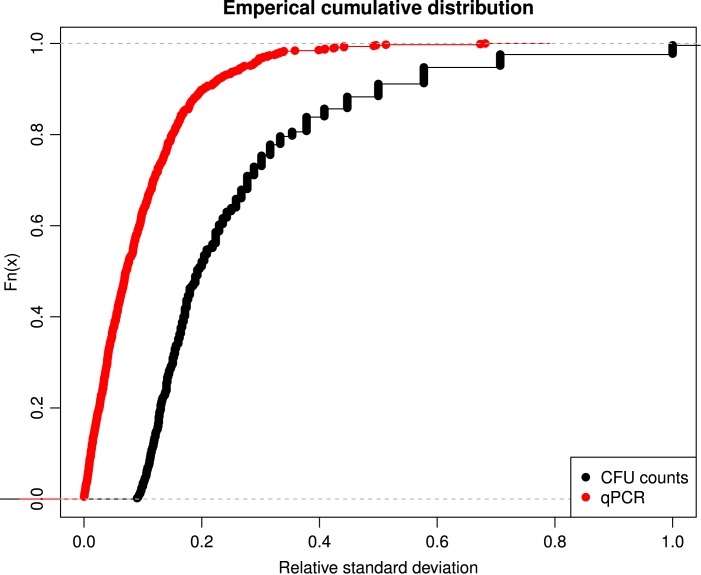
Fig 3. Relative standard deviations of the coliform CFU and qPCR gene copy number estimates g-1 feces.
Empirical cumulative distribution (Fn(x)) plotted against the relative standard deviations of the CFU and gene copy number estimates illustrating the relationship between uncertainties of calculated estimates and the true laboratory determined estimates for CFU counts (black) and qPCR gene copy numbers (red), respectively.

