Figure 5.

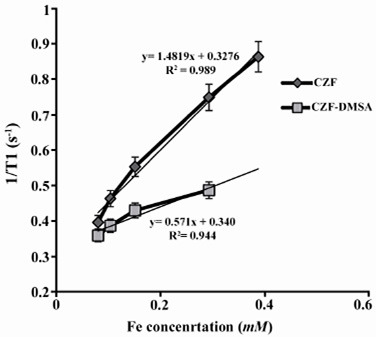
Plot of longitudinal relaxivity (1/T1) for CZF-MNPs and CZF-MNPs-DMSA as a function of different Fe concentrations (mM).

Plot of longitudinal relaxivity (1/T1) for CZF-MNPs and CZF-MNPs-DMSA as a function of different Fe concentrations (mM).