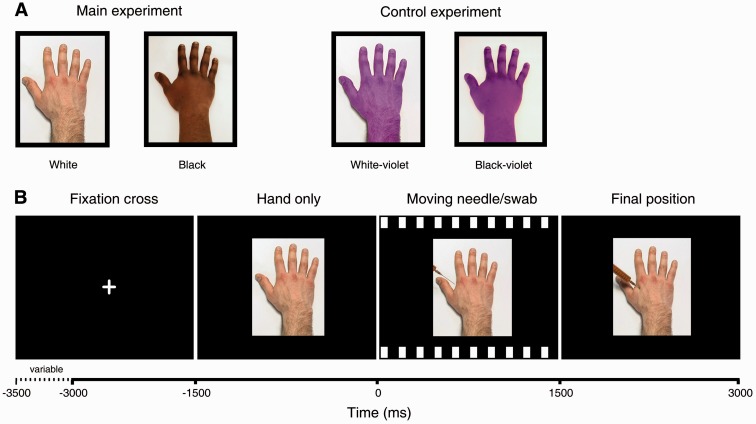
Fig. 1.
Schematic display of the visual stimuli and their timing as used in the EEG experiment. A. Hands used as visual stimuli in the main and the control experiment. B. The trial sequence began with presenting a fixation cross (white on black background, duration varied between 1500 and 2000 ms), followed by a static display of a hand for a duration of 1500 ms. This static hand was followed by the video showing the action of hand treatment (i.e. motion of a needle syringe or a cotton swab, duration = 1500 ms). After the needle syringe or the cotton swab had reached their final position, a static display of this last frame of the video was shown for a duration of 1500 ms. This trial structure enabled us to assess unspecific responses to viewing pictures of hands of different ethnicity, as compared with the specific responses to painful or non-painful treatments of those hands.

